94 Maps
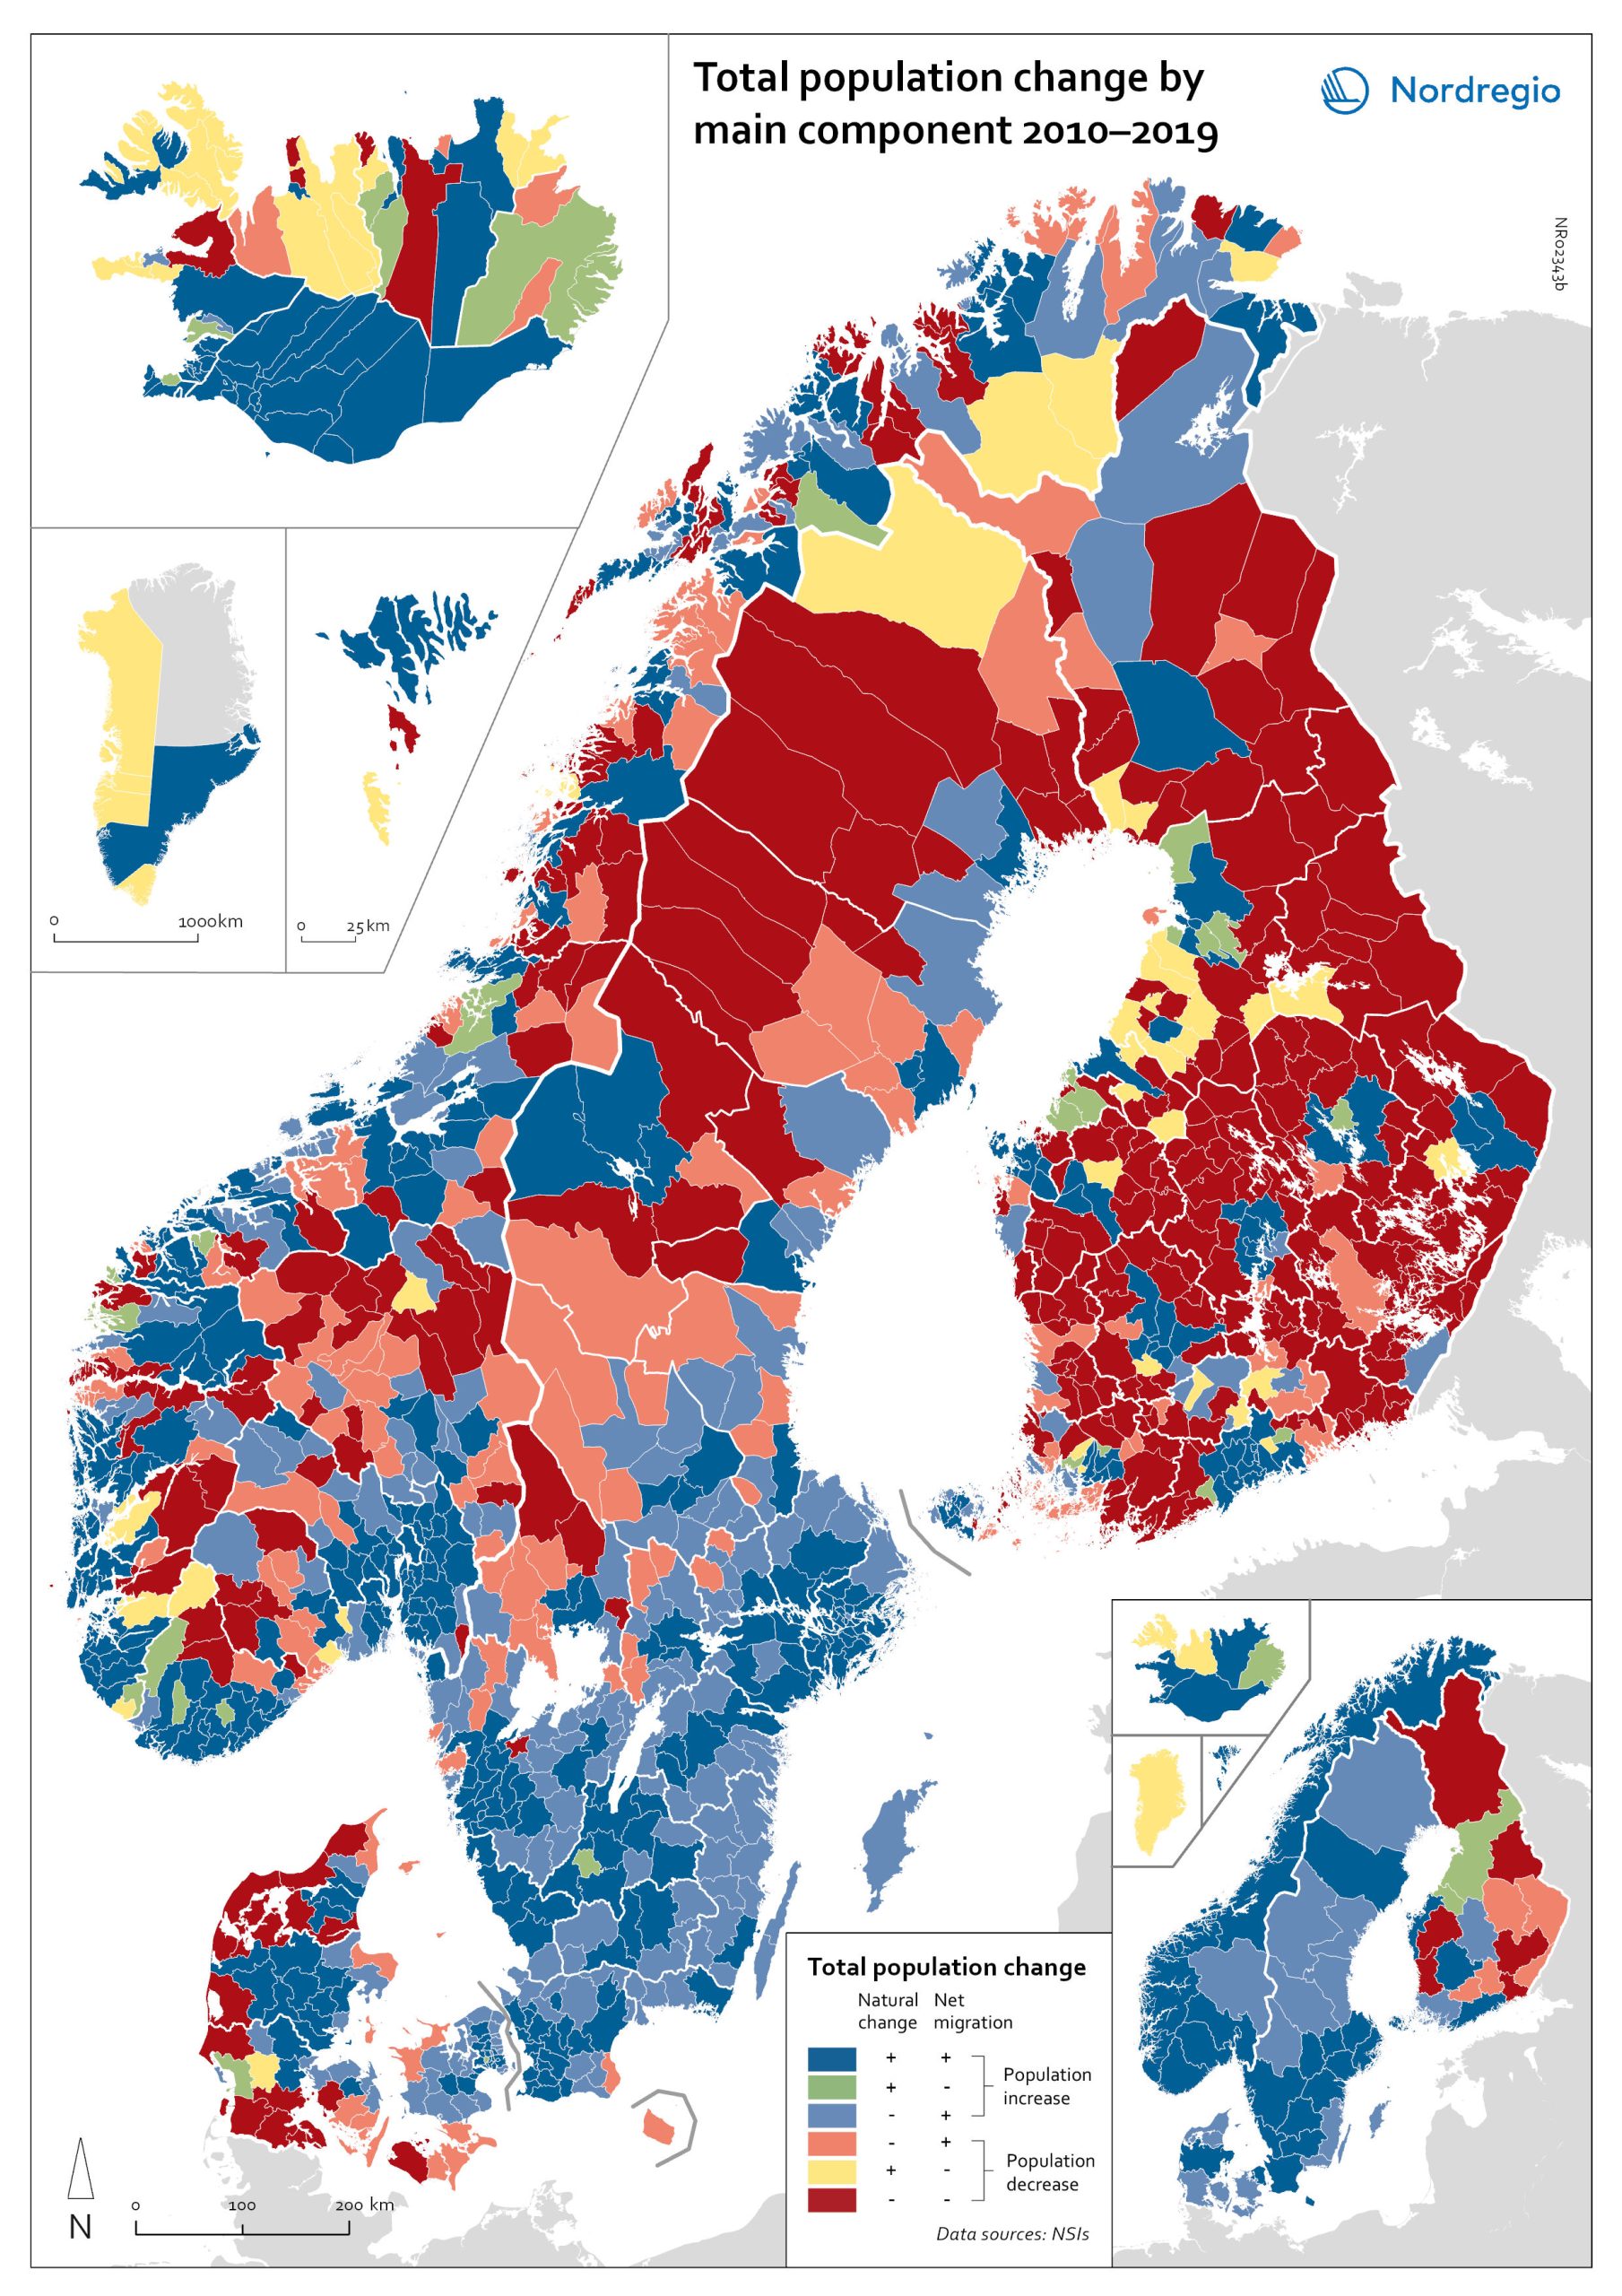
Population change by component 2010-2019
The map shows the population change by component 2010-2019. The map is related to the same map showing regional and municipal patterns in population change by component in 2020. Regions are divided into six classes of population change. Those in shades of blue or green are where the population has increased, and those in shades of red or yellow are where the population has declined. At the regional level (see small inset map), all in Denmark, all in the Faroes, most in southern Norway, southern Sweden, all but one in Iceland, all of Greenland, and a few around the capital in Helsinki had population increases in 2010-2019. Most regions in the north of Norway, Sweden, and Finland had population declines in 2010-2019. Many other regions in southern and eastern Finland also had population declines in 2010-2019, mainly because the country had more deaths than births, a trend that pre-dated the pandemic. In 2020, there were many more regions in red where populations were declining due to both natural decrease and net out-migration. At the municipal level, a more varied pattern emerges, with municipalities having quite different trends than the regions of which they form part. Many regions in western Denmark are declining because of negative natural change and outmigration. Many smaller municipalities in Norway and Sweden saw population decline from both negative natural increase and out-migration despite their regions increasing their populations. Many smaller municipalities in Finland outside the three big cities of Helsinki, Turku, and Tampere also saw population decline from both components. A similar pattern took place at the municipal level in 2020 of there being many more regions in red than in the previous decade.
 2022 March
 - Demography
- Migration
- Nordic Region
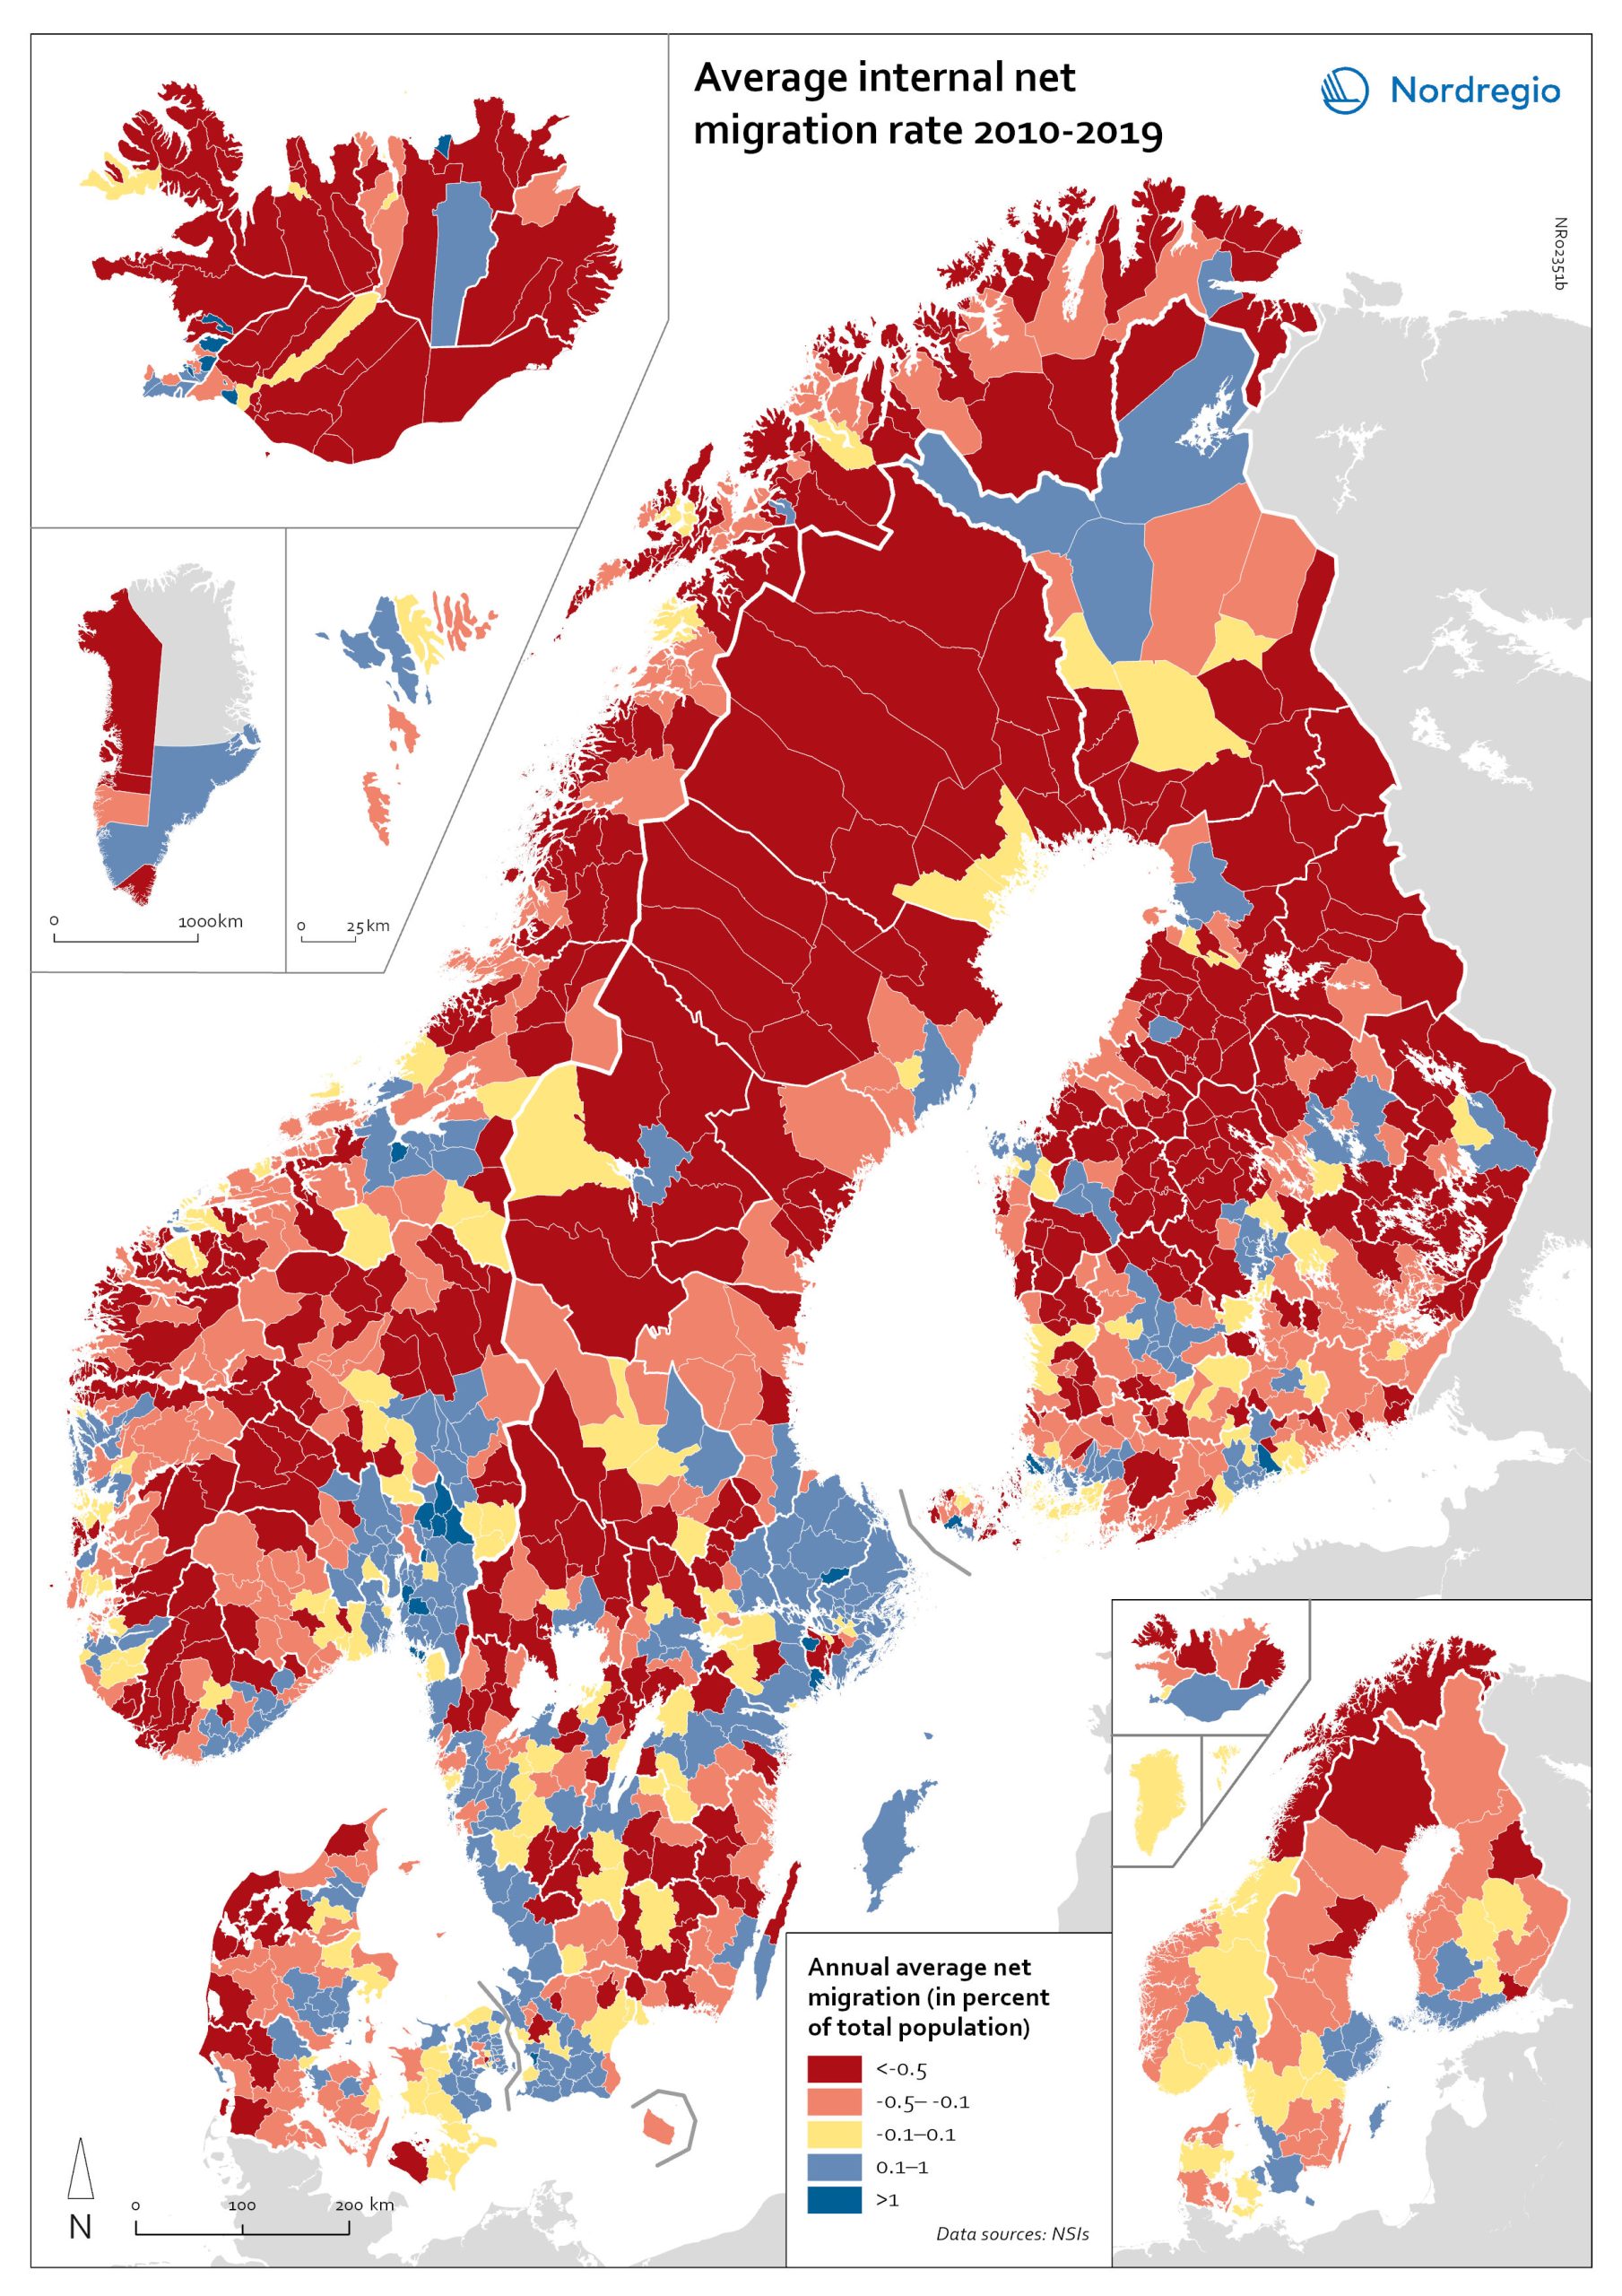
Net internal migration rate, 2010-2019
The map shows the annual average internal net migration in 2010-2019. The map is related to the same map showing net internal migration in 2020. The maps show several interesting patterns, suggesting that there may be an increasing trend towards urban-to-rural countermigration in all the five Nordic countries because of the pandemic. In other words, there are several rural municipalities – both in sparsely populated areas and areas close to major cities – that have experienced considerable increases in internal net migration. In Finland, for instance, there are several municipalities in Lapland that attracted return migrants to a considerable degree in 2020 (e.g., Kolari, Salla, and Savukoski). Swedish municipalities with increasing internal net migration include municipalities in both remote rural regions (e.g., Åre) and municipalities in the vicinity of major cities (e.g., Trosa, Upplands-Bro, Lekeberg, and Österåker). In Iceland, there are several remote municipalities that have experienced a rapid transformation from a strong outflow to an inflow of internal migration (e.g., Ásahreppur, Tálknafjarðarhreppurand, and Fljótsdalshreppur). In Denmark and Norway, there are also several rural municipalities with increasing internal net migration (e.g., Christiansø in Denmark), even if the patterns are somewhat more restrained compared to the other Nordic countries. Interestingly, several municipalities in capital regions are experiencing a steep decrease in internal migration (e.g., Helsinki, Espoo, Copenhagen and Stockholm). At regional level, such decreases are noted in the capital regions of Copenhagen, Reykjavík and Stockholm. At the same time, the rural regions of Jämtland, Kalmar, Sjælland, Nordjylland, Norðurland vestra, Norðurland eystra and Kainuu recorded increases in internal net migration. While some of the evolving patterns of counterurbanisation were noted before 2020 for the 30–40 age group, these trends seem to have been strengthened by the pandemic. In addition to return migration, there may be a larger share of young adults who…
- 2022 March
- Demography
- Migration
- Nordic Region
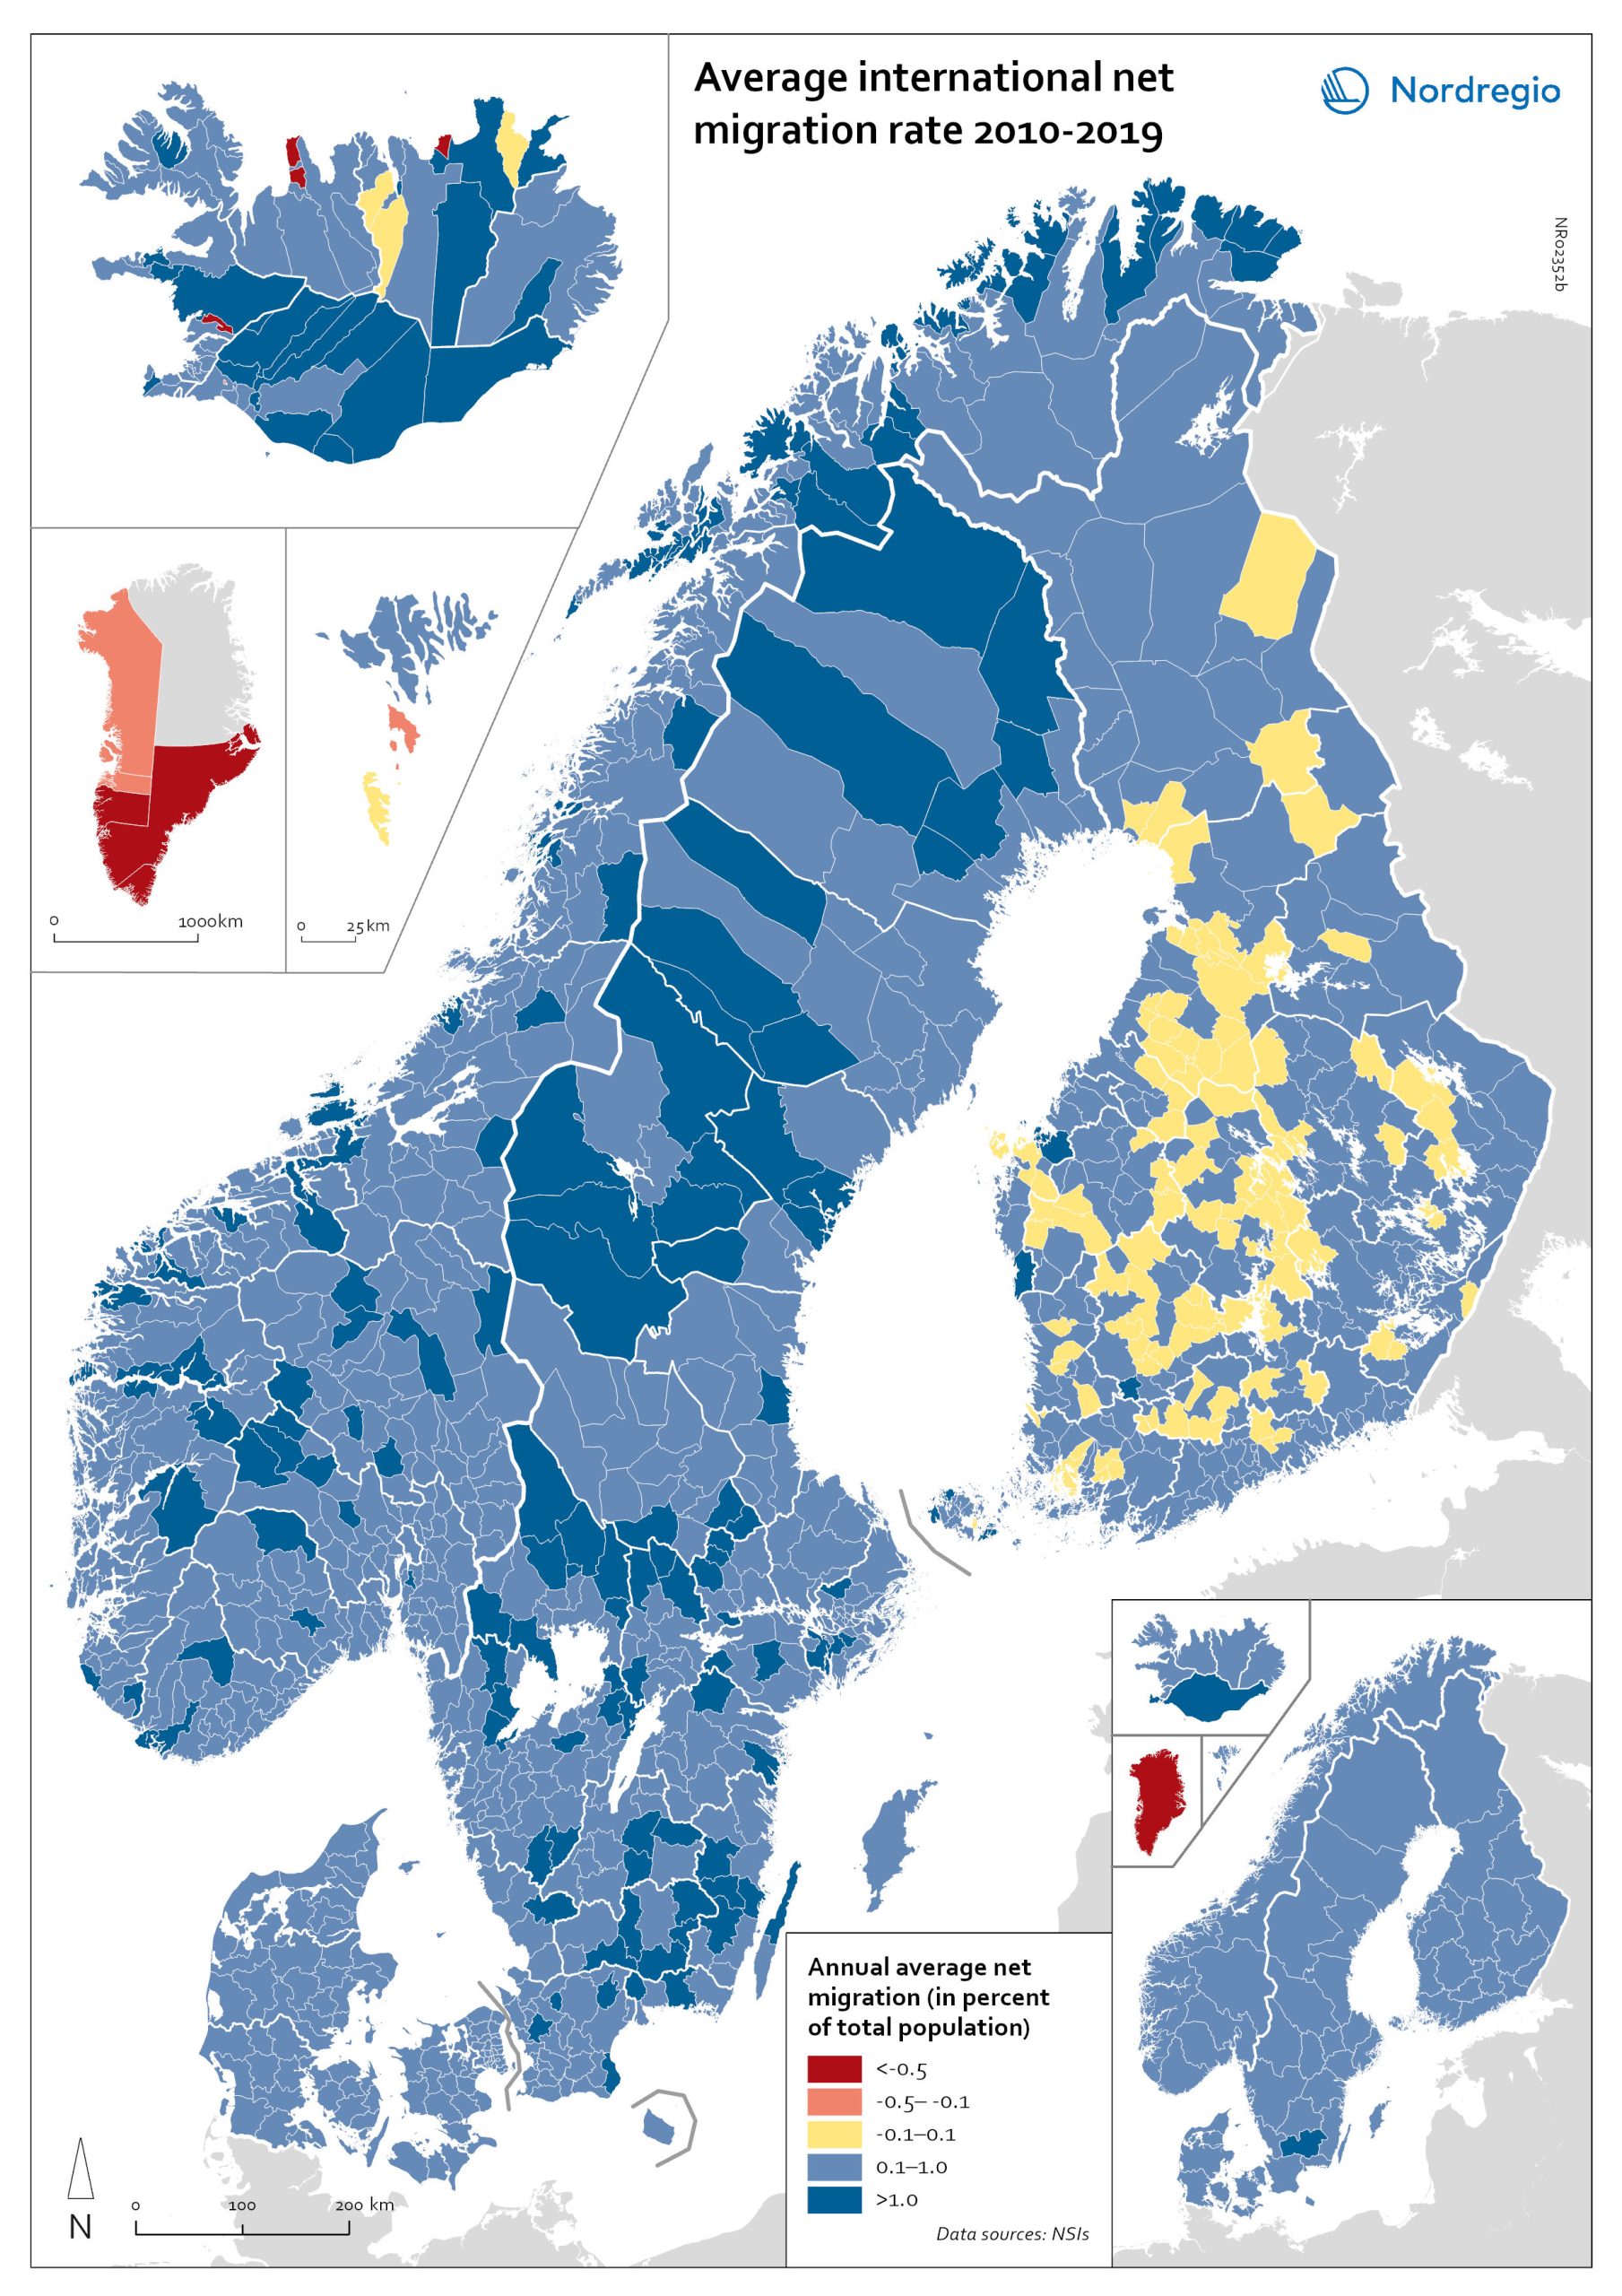
Net international migration rate, 2010–2019
The map shows the annual average international net migration from 2010 to 2019. The map is related to the same map showing net migration in 2020. At regional level, there are only minor changes between the net migration in 2010-2019 and 2020. All regions of Norway, all regions of Sweden except Gotland and Uppsala, and the regions of Österbotten in Finland, Midtjylland in Denmark and Norðurland eystra in Iceland experienced a slight decrease in international net migration I 2020 compared to 2010-2019. There is a more marked increase in net migration in the Faroe Islands, Greenland and the region of Norðurland vestra in Iceland, and a slight increase in the region of Austurland in Iceland. At municipal level, the maps show more changing patterns. In Denmark, Norway and Sweden, several municipalities – both in the capital, intermediate, and rural regions – had lower levels of international net migration in 2020 compared to 2010-2019. In Iceland and Finland, the picture is more balanced, with some municipalities showing a decrease, others an increase. In the Faroe Islands and Greenland, several municipalities/regions had an increase in international net migration.
- 2022 March
- Demography
- Migration
- Nordic Region
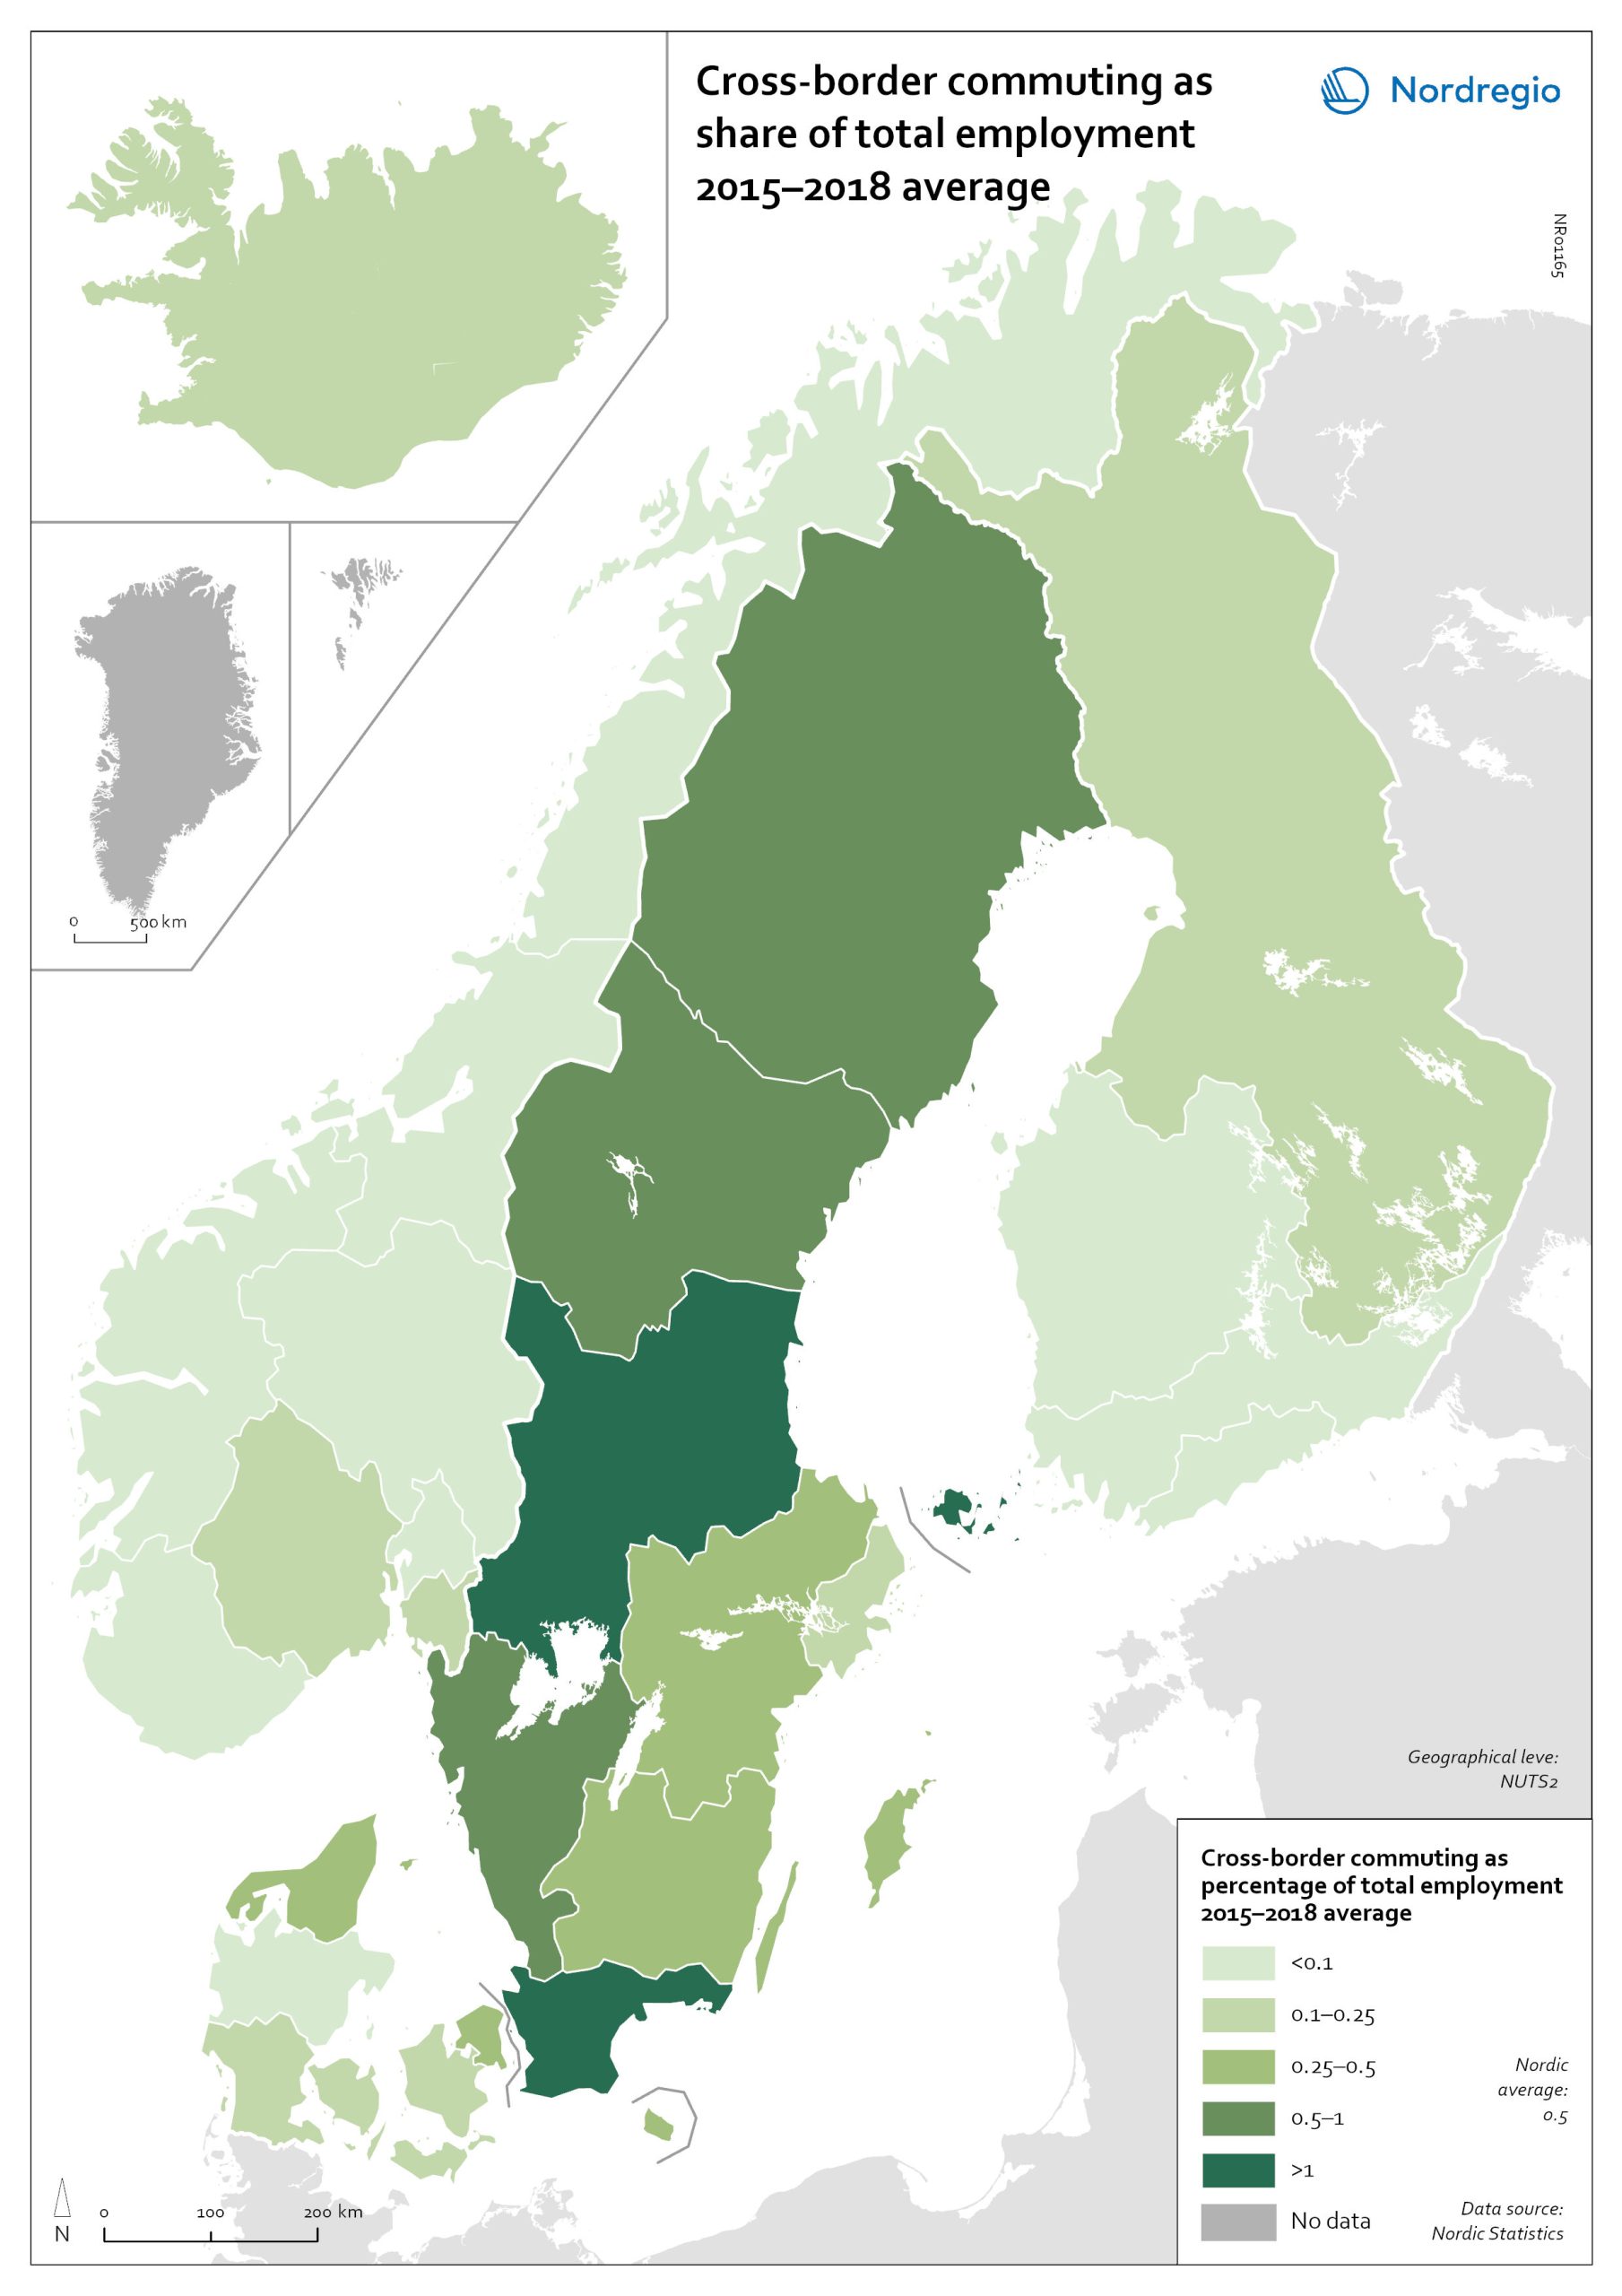
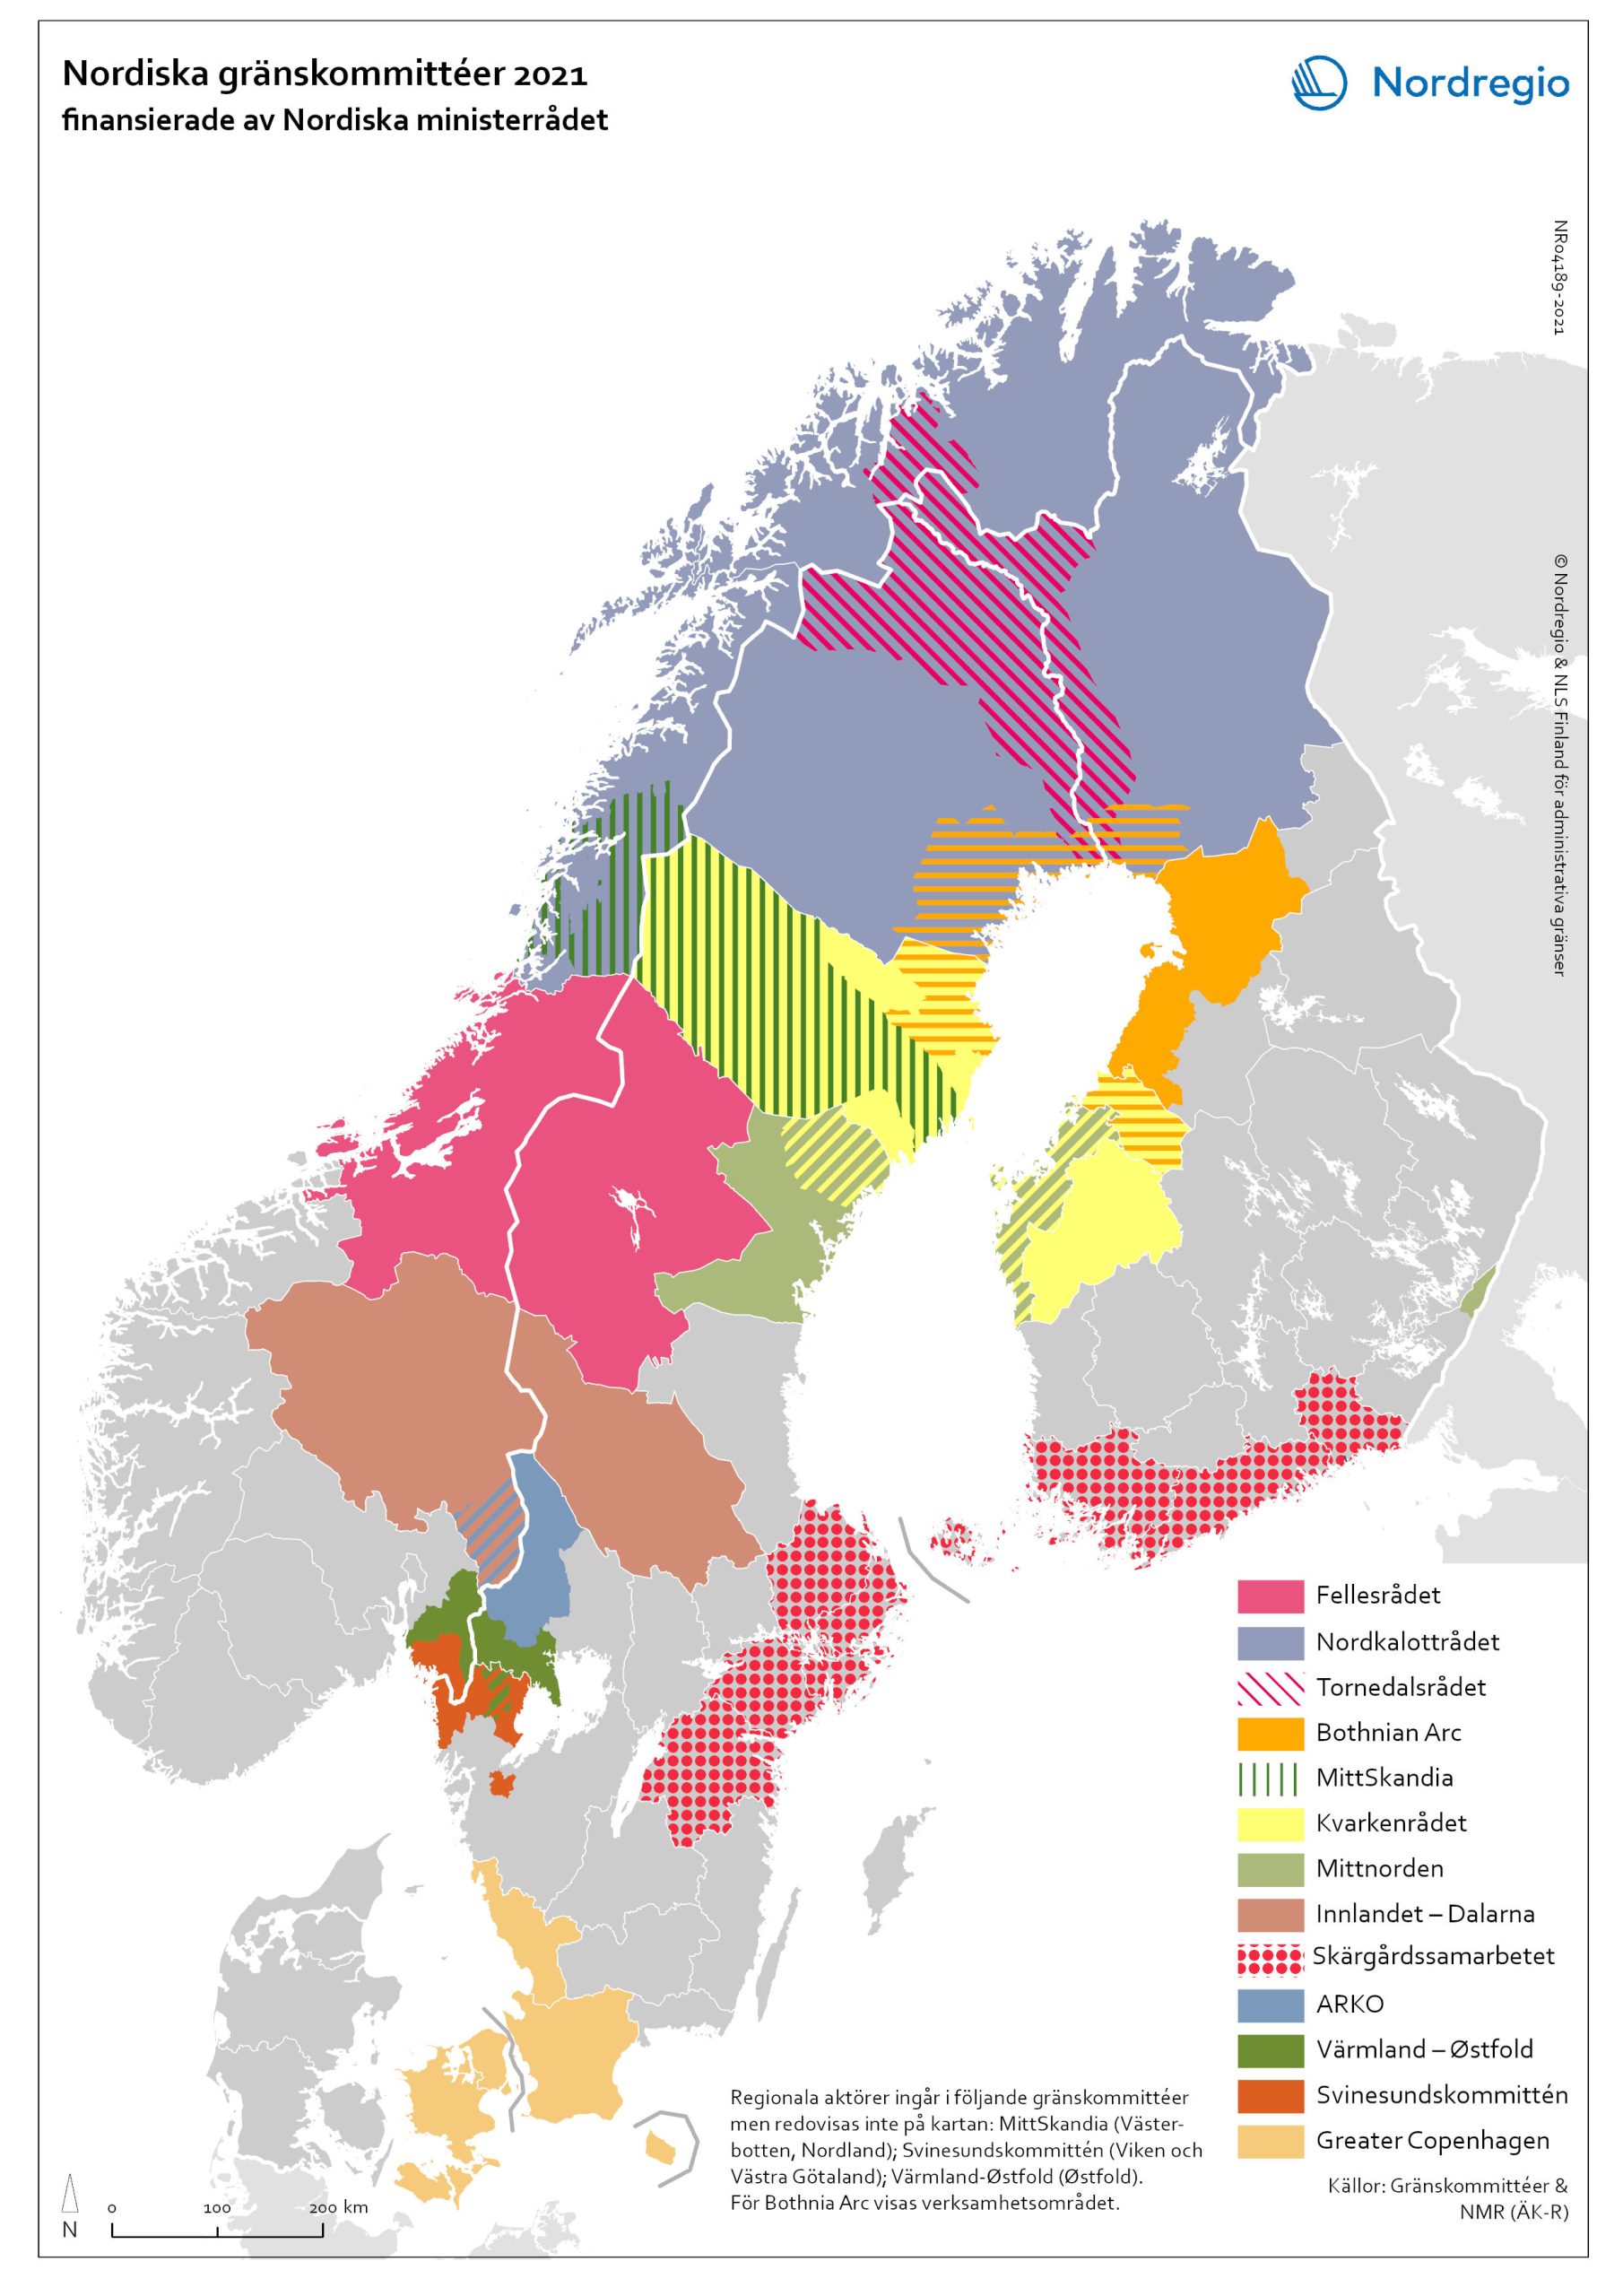
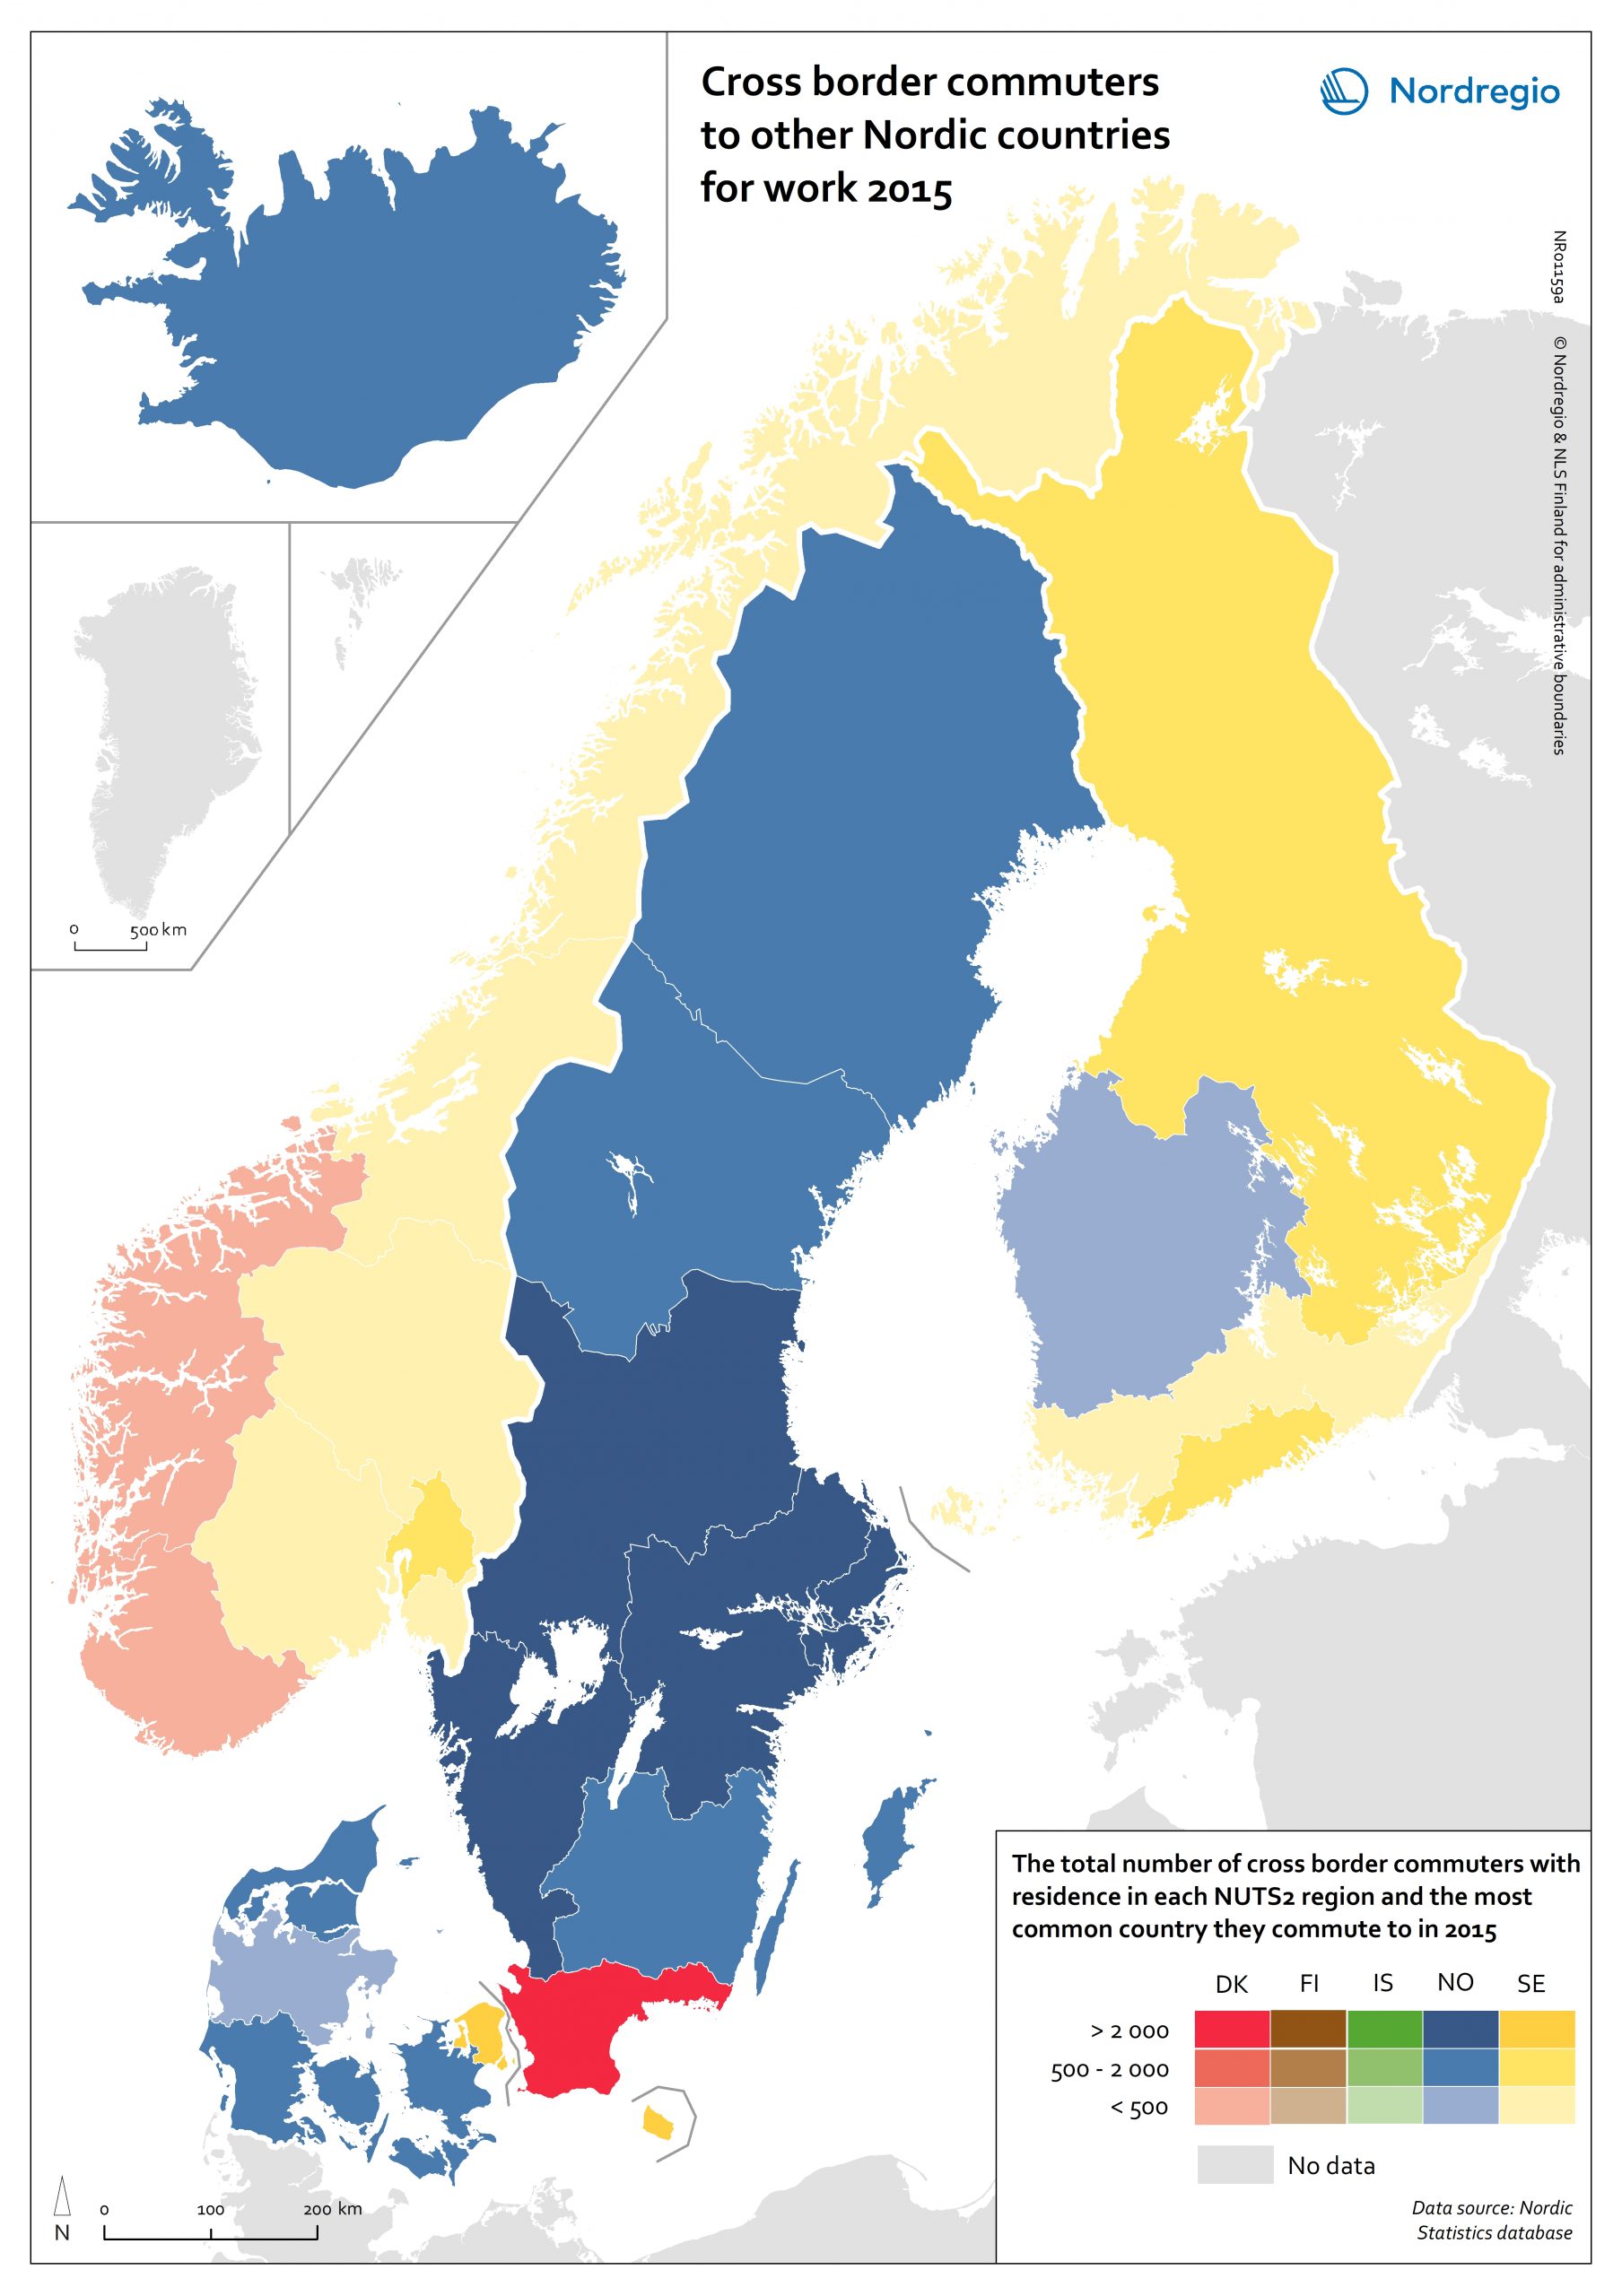
Cross-border commuting as share of employment
The map illustrates the average share of employees who commuted to another Nordic country between between 2015 and 2018 in Nordic regions (NUTS 2). Between 2015 and 2018, an average of approximately 49,000 people held a job in a Nordic country in which they were not residents. This indicates that, on average, 0.5% of the Nordic working-age population commuted to a job in another Nordic country. This is below the EU27 average of 1%, with the highest numbers found in Slovakia (5.1%), Luxembourg (2.8%) and Estonia (2.6%). Some of these people cross borders daily. Others work in another country by means of remote working combined with occasional commuting across borders. Within the Nordic Region, the largest cross-border commuter flows are in the southernmost parts of Sweden, regions in the middle of Sweden and in Åland, where more than 1% of the working population commutes to another Nordic country. However, there may be individual municipalities where cross-border commuting is substantially higher. For example, the employment rate in Årjäng Municipality, Sweden, increases by 15 percentage points when cross-border commuting is taken into account. These municipalities are not reflected on NUTS 2 level when averages are calculated. In terms of absolute numbers in 2015, the highest numbers of commuters were from Sweden: Sydsverige (16,543), Västsverige (7,899) and Norra Mellansverige (6,890). The highest number of commuters from a non-Swedish region were from Denmark’s Hovedstaden (2,583). Due to legislative barriers regarding the exchange of statistical data on cross-border commuting between the Nordic countries, more recent data is not available.
- 2022 March
- Labour force
- Nordic Region
- Transport
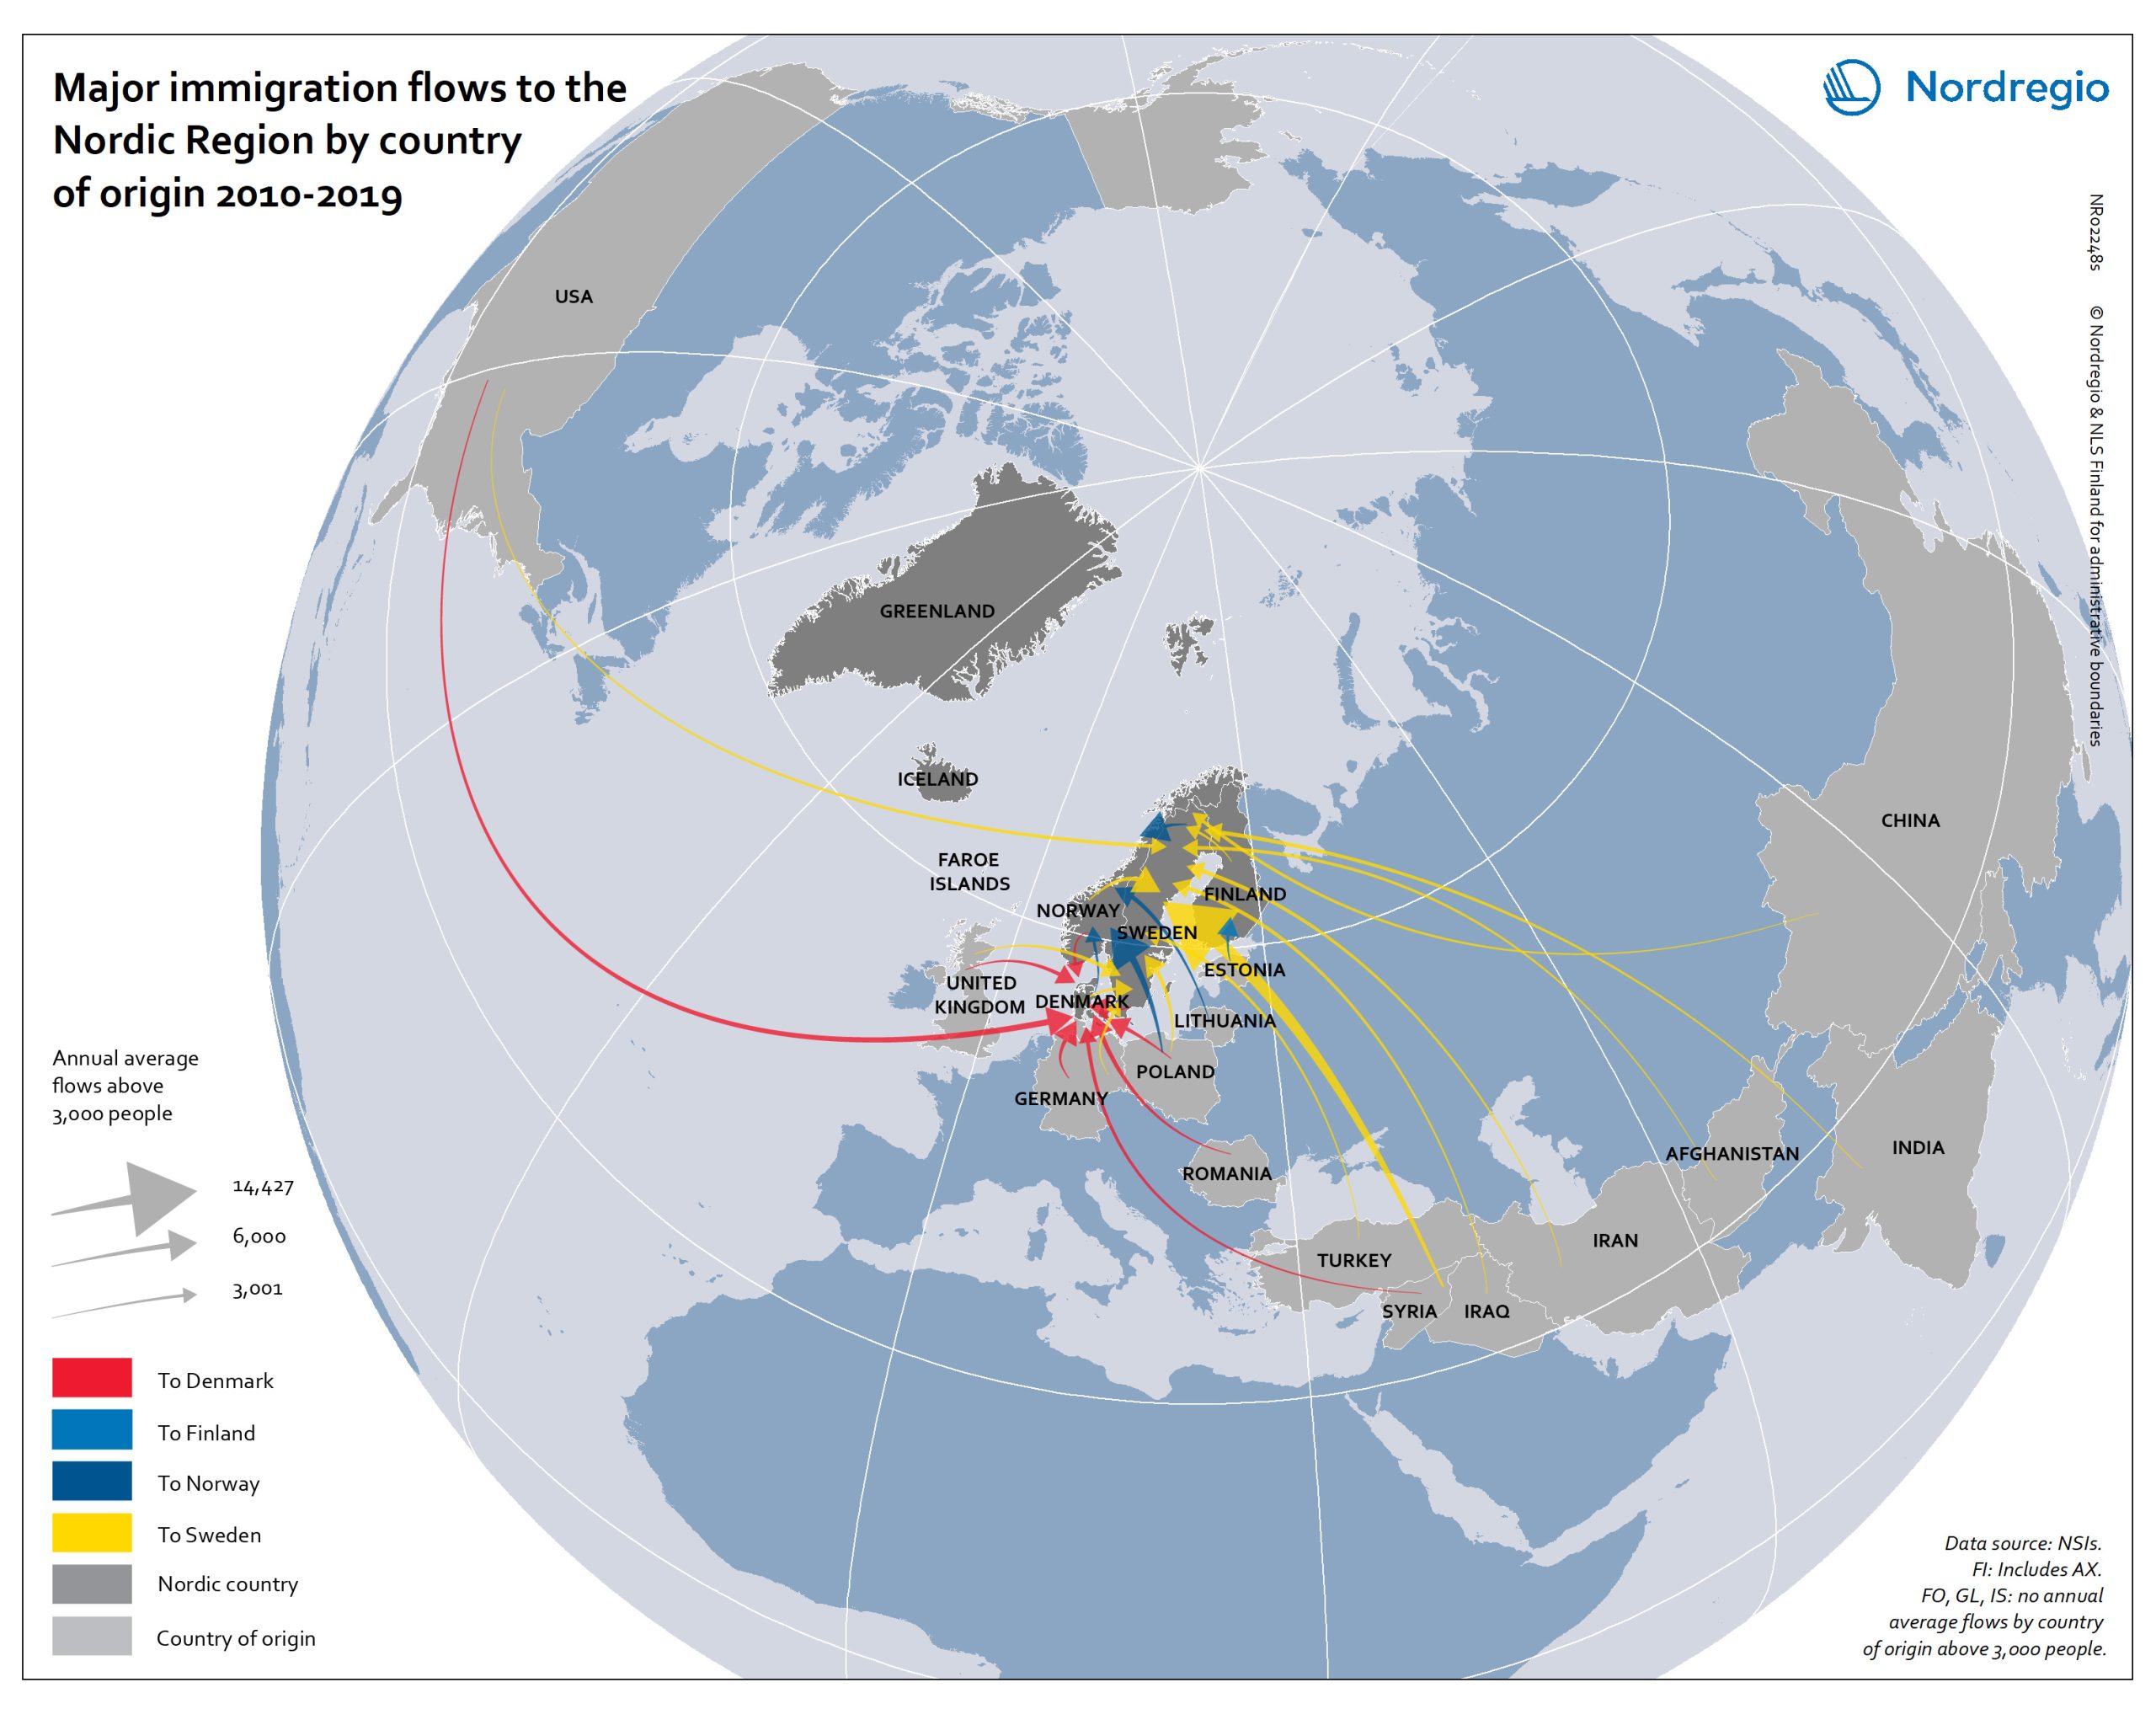
Major immigration flows to the Nordic Region from 2010 to 2019
The map shows annual average immigration flows above 3,000 people, and the growing diversity in their countries of origin Sweden and Denmark, in particular, experienced large inflows from non-Nordic countries during the period 2010-2019, with Sweden standing out as the Nordic country with by far the largest immigrant in-flows. A large portion of these arrivals were from war-torn Syria (an annual average of almost 15,000), followed by Poland (approximately 4,500), United Kingdom, Iraq, India and Iran (around 4,000 each). Denmark experienced a smaller number of inflows above 3,000 people, compared to Sweden. The largest non-Nordic inflows to Denmark were around 5,000 people (per sending country) and included migrants from the U.S., Germany, Romania and Poland. For Norway, large non-Nordic in-flows were limited to Lithuania and Poland. Similarly, Finland had only one major inflow, from Estonia.
- 2021 December
- Migration
- Nordic Region
Change in share of biofuels in transport from 2010 to 2018
This map shows change in share of biofuels in final energy consumption in transport in the Nordic Arctic and Baltic Sea Region from 2010 to 2018. Even though a target for greater use of biofuels has been EU policy since the Renewable Energy and Fuel Quality Directives of 2009, development has been slow. The darker shades of blue on the map represent higher increase, and the lighter shades of blue reflect lower increase. The lilac color represent decrease. The Baltic Sea represents a divide in the region, with countries to the north and west experiencing growth in the use of biofuels for transport in recent years. Sweden stands out (16 per cent growth), while the other Nordic countries has experienced more modest increase. In the southern and eastern parts of the region, the use of biofuels for transport has largely stagnated. Total biofuel consumption for transport has risen more than the figure indicates due to an increase in transport use over the period.
- 2021 December
- Arctic
- Baltic Sea Region
- Nordic Region
- Transport
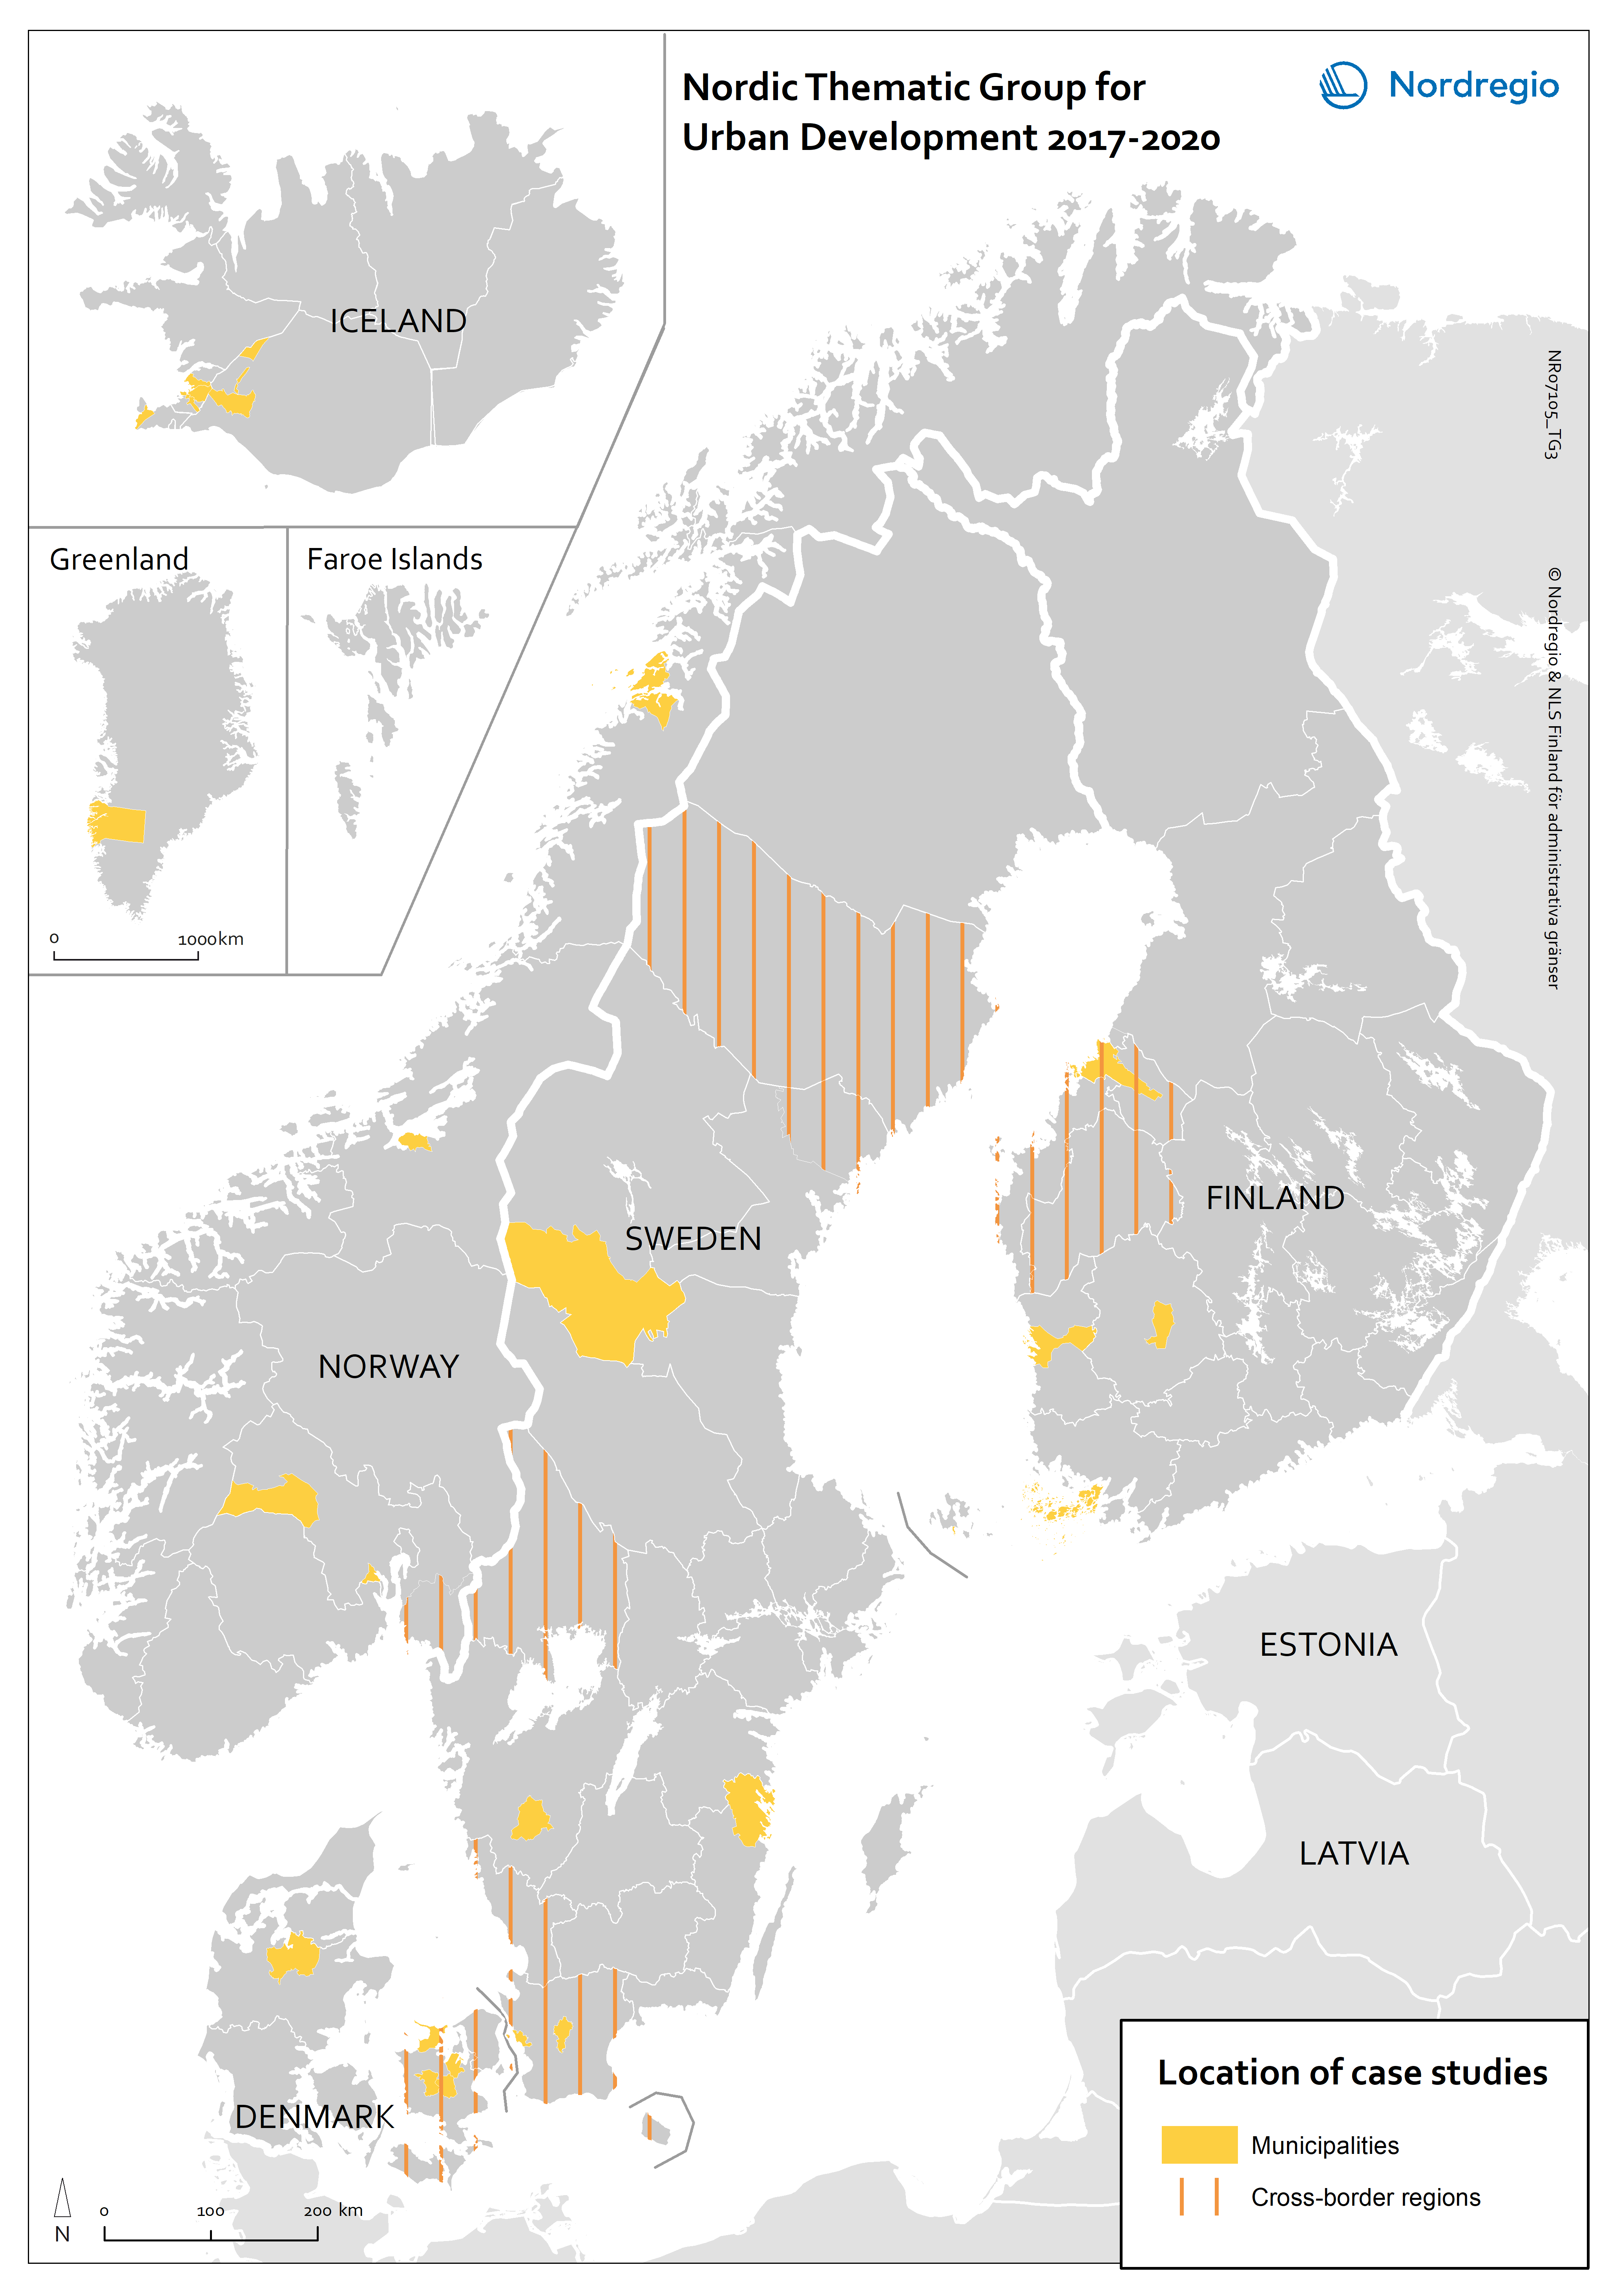
Nordic Thematic Group for Urban Development 2017-2020: location of case studies
This map indicates the geographical areas involved in case studies and more in-depth research but does not cover municipalities and other areas involved in e.g. questionnaires or more general studies.
- 2021 February
- Nordic Region
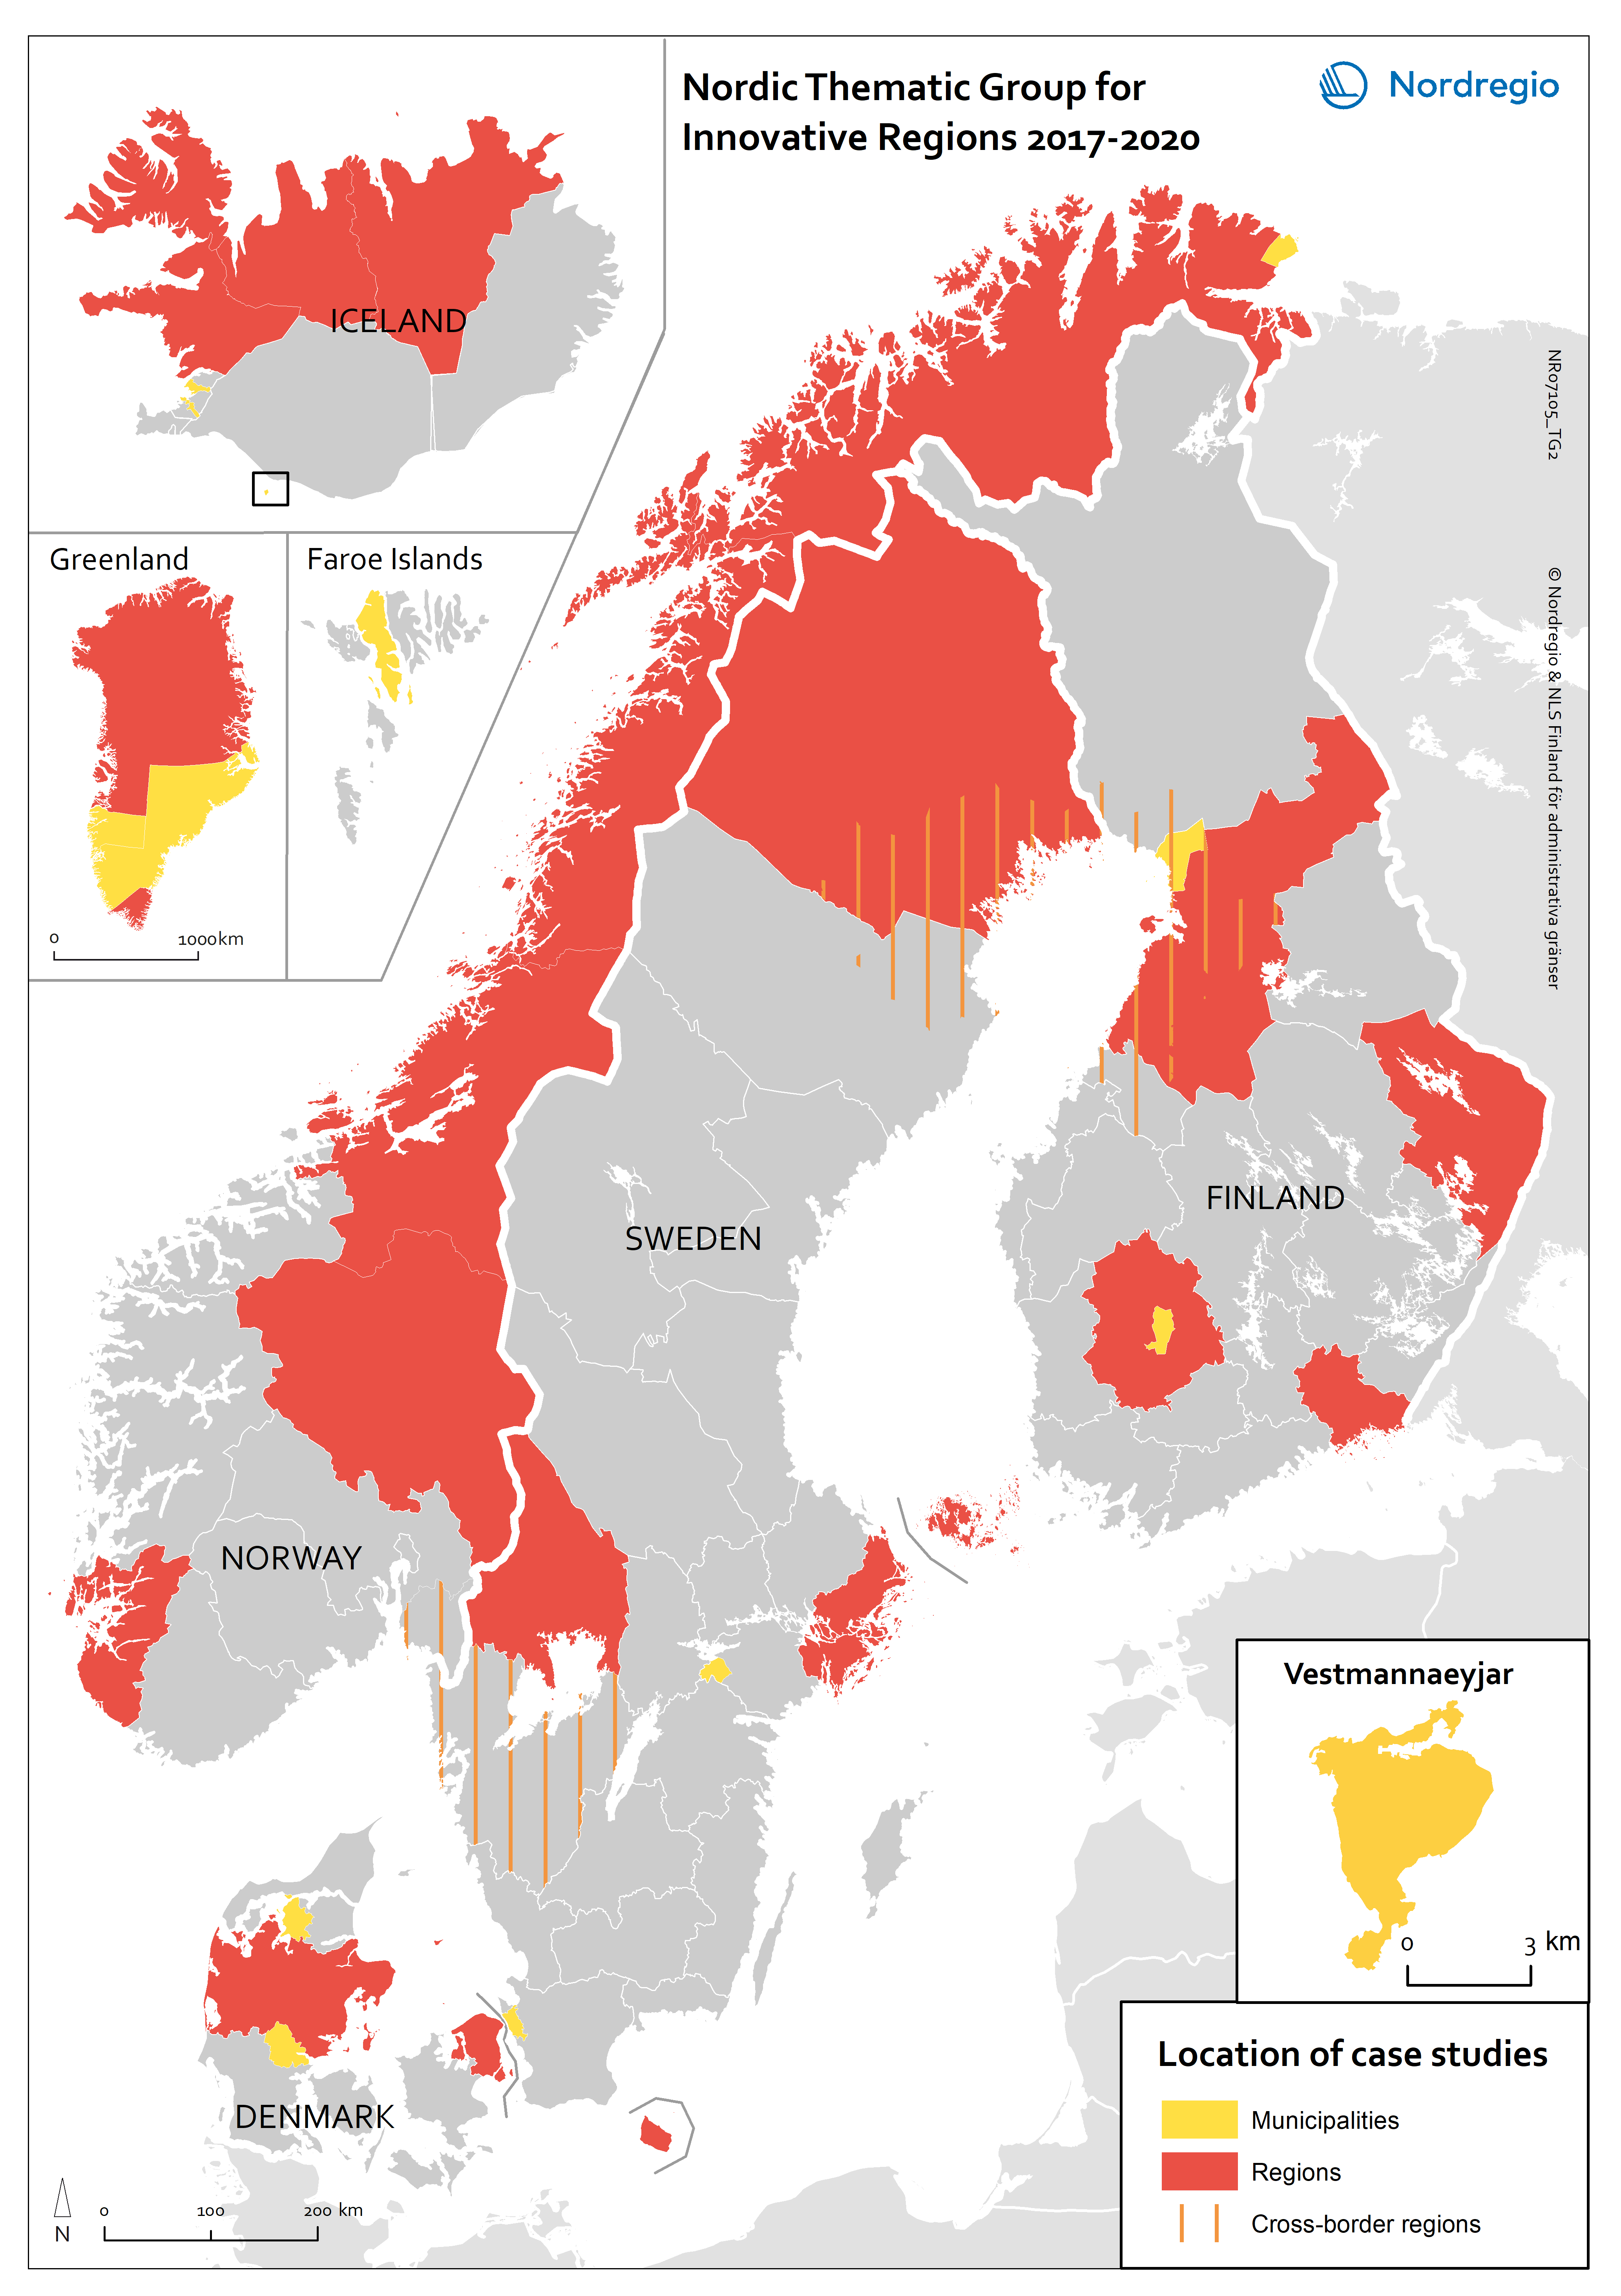
Nordic Thematic Group for Innovative Regions 2017-2020: location of case studies
This map indicates the geographical areas involved in case studies and more in-depth research but does not cover municipalities and other areas involved in e.g. questionnaires or more general studies.
- 2021 February
- Nordic Region
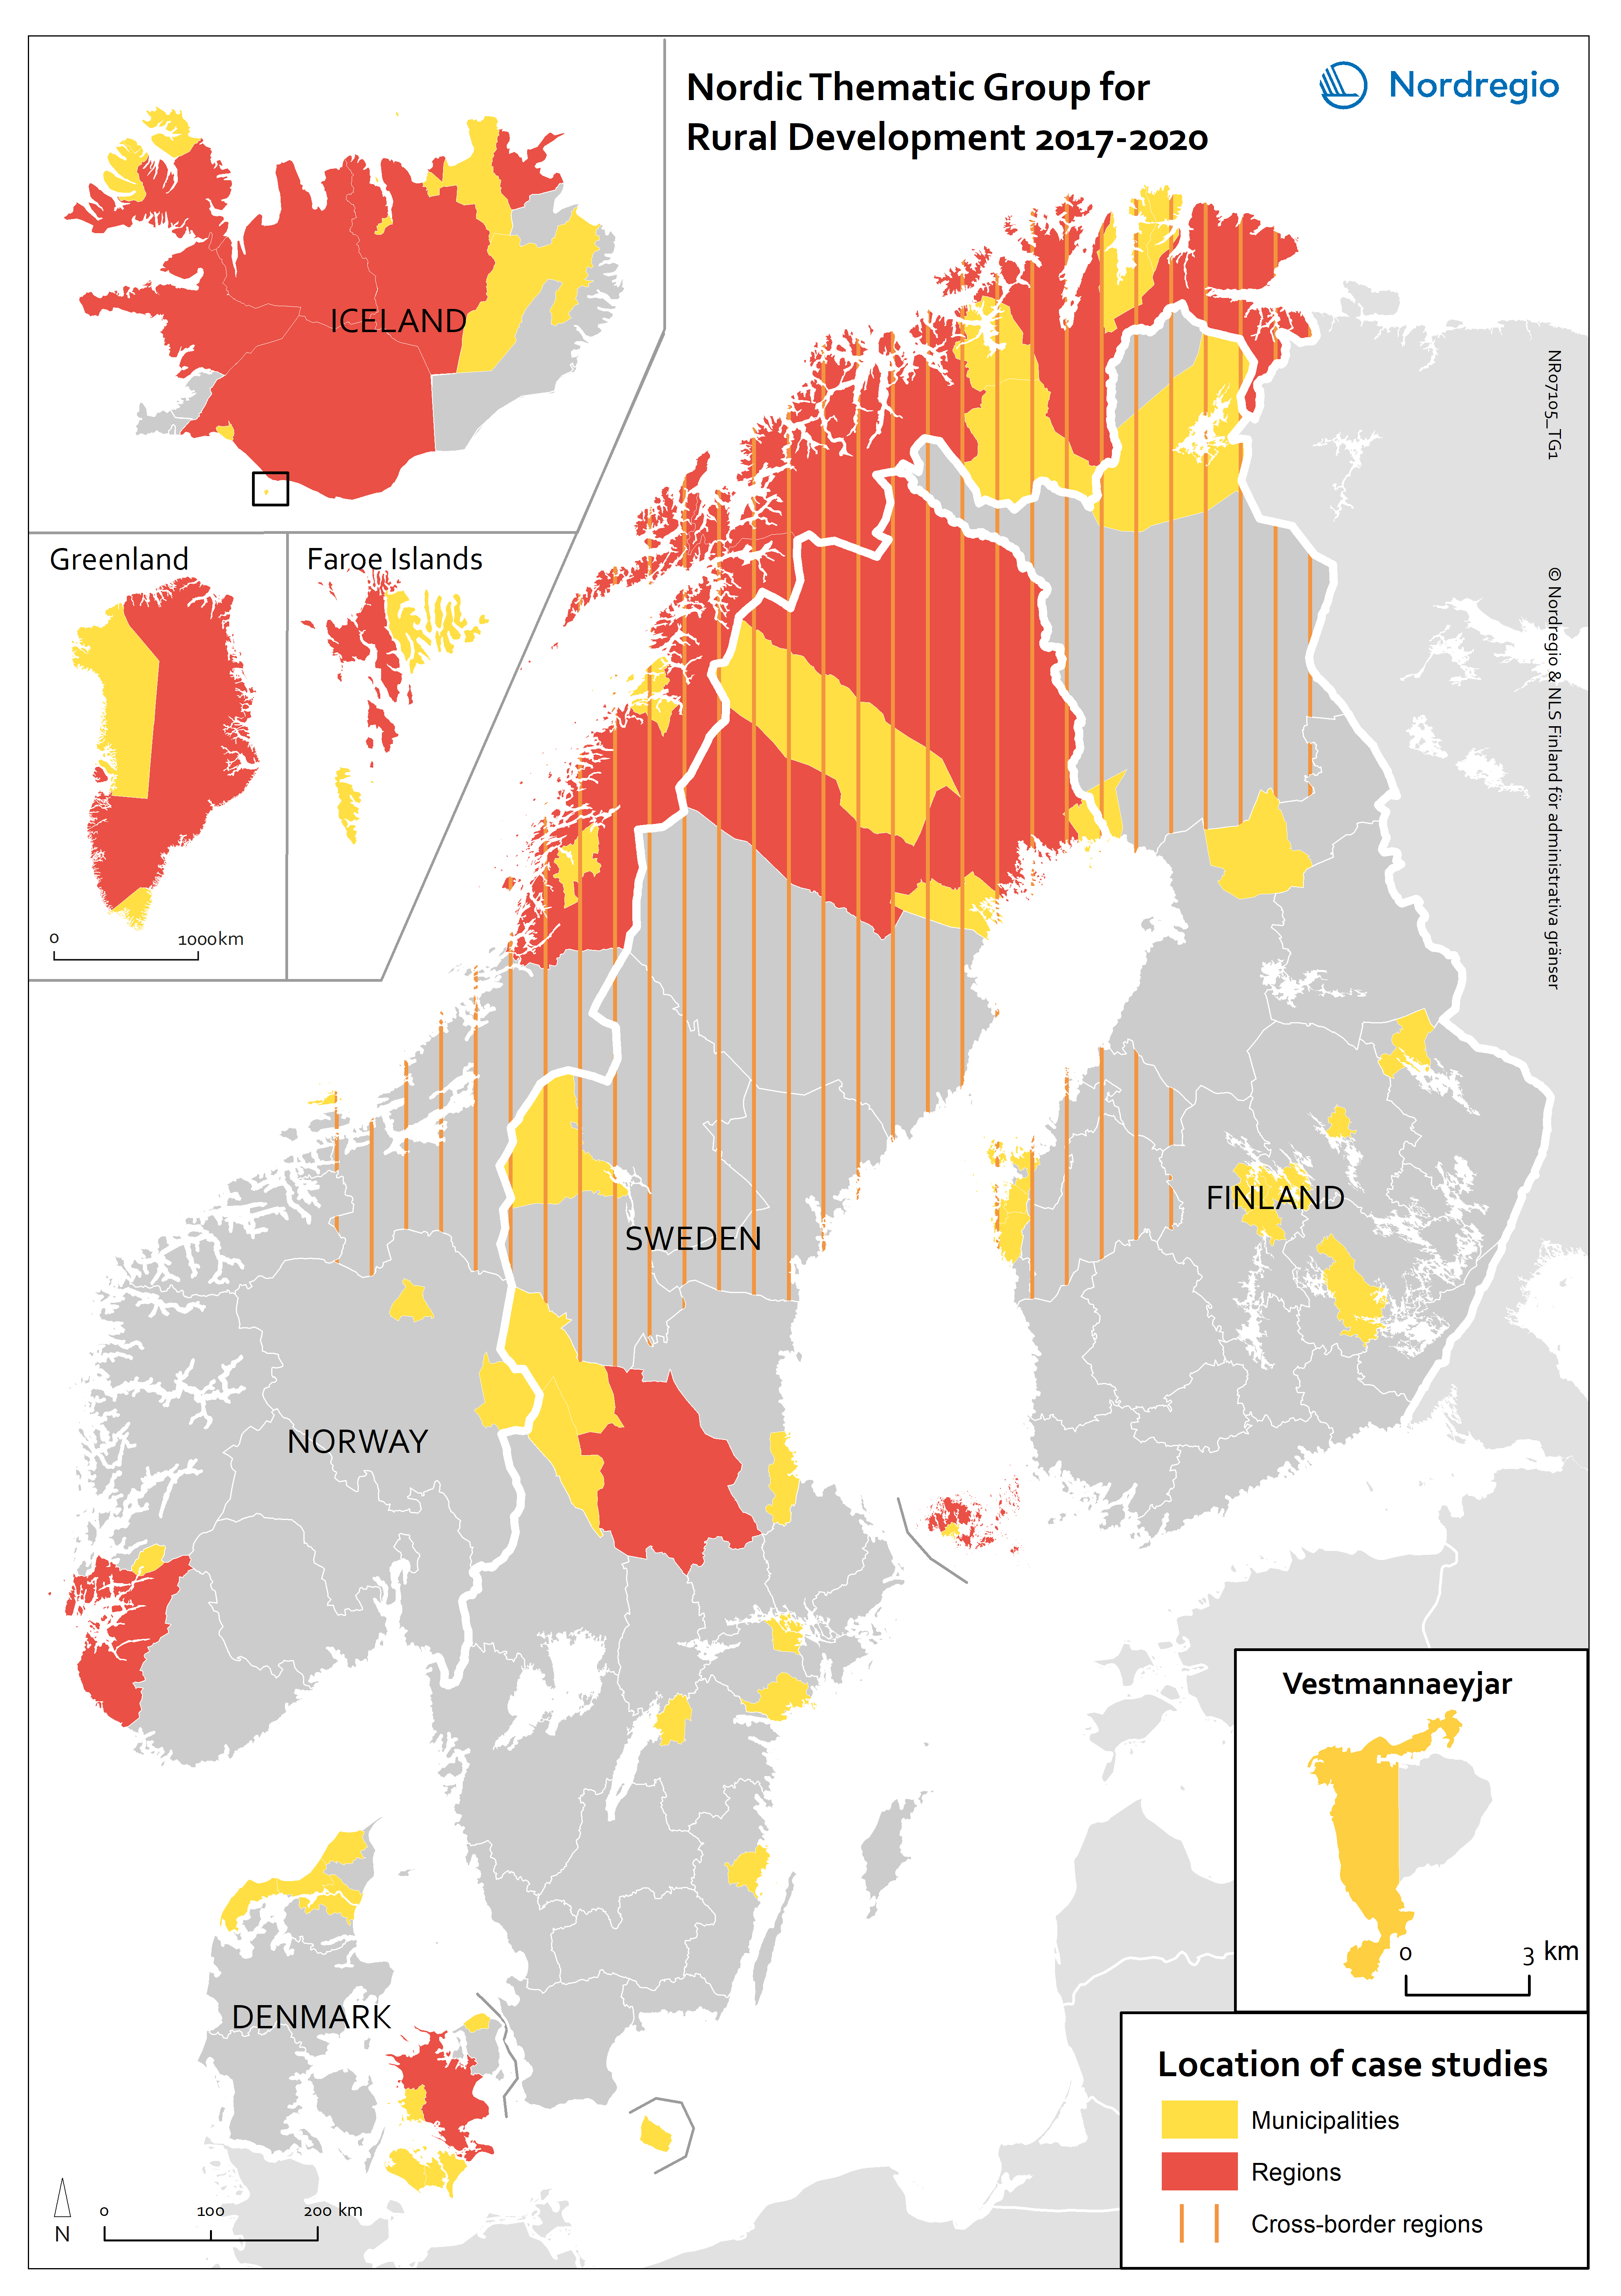
Nordic Thematic Group for Rural Development 2017-2020: location of case studies
This map indicates the geographical areas involved in case studies and more in-depth research but does not cover municipalities and other areas involved in e.g. questionnaires or more general studies.
- 2021 February
- Nordic Region

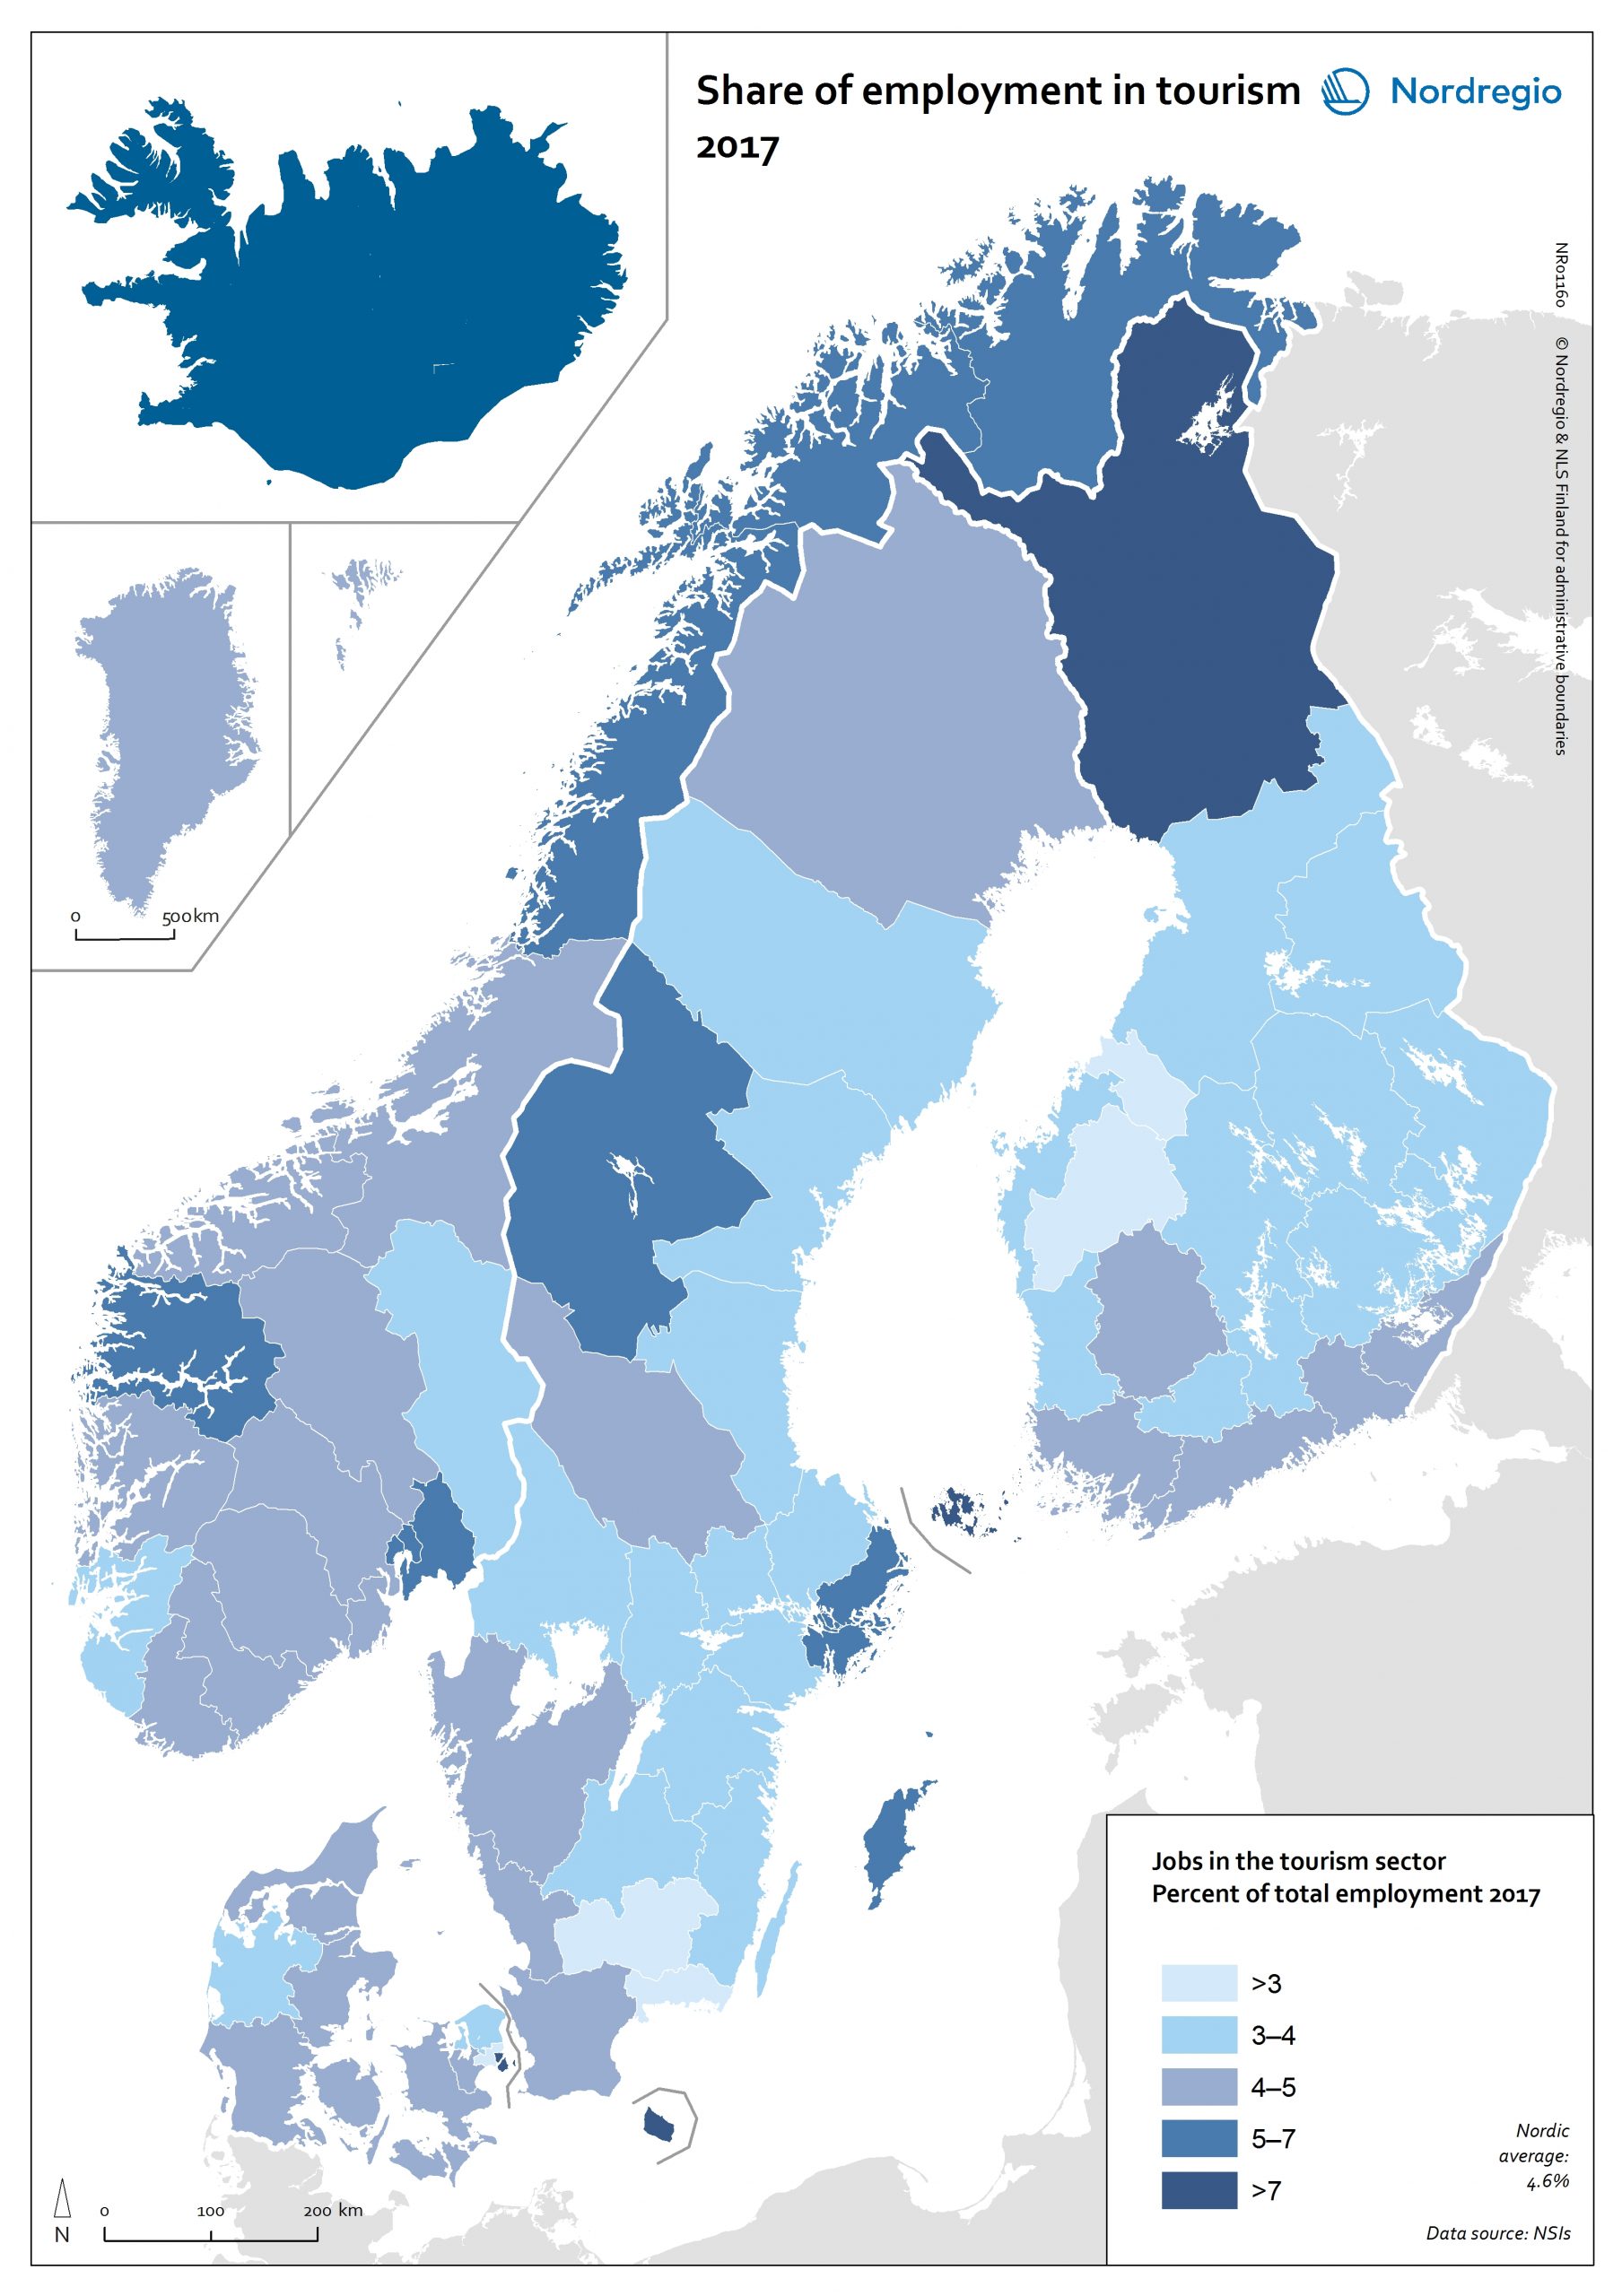
Share of employment in tourism 2017
The map shows the share of employed people in tourism industry in 2017. On a national level the share of tourism is quite similar in the Nordic countries, except for Iceland where the share is more than double as high. In Iceland it is especially the sector “Accommodation and food service activities” that stands out. This category alone stood for 6.9% of the total employment in Iceland in 2017 . On a regional level Åland stands out with 14.7% of employment in tourism. In Åland it is mainly the category “Sea passenger transport” that is big. Only this category stands for 9.8% of the employment. Also other islands such as Gotland and Bornholm have a high share of employment in tourism as well as the capital cities of Copenhagen and Stockholm. Jämtland attracts many tourists in the winter. The regions with the lowest share of tourism employment include the Finnish regions Keski-Pohjanmaa and Etelä-Pohjanmaa (both 2,7%); Københavns omegn (2.9%) and Vestjylland (3.4%) in Denmark; Blekinge (3.3%) and Kronoberg (3.3%) in Sweden and Østfold (3.5%) in Norway. The data on employment by sector is classified using the NACE classification system (“nomenclature statistique des activités économiques dans la Communauté européenne”). To define which sectors that tourism comprise of, we have selected the Eurostat’s definition due to the fact that Eurostat has adapted the definition of UNWTO to a European context to make it more precise and to avoid overestimate certain economic activities (e.g. real estate activities). Their definition is also very close to the definition used by Tillväxtverket. Eurostat thus defines tourism as comprising the following economic activities : H4910 Passenger rail transport, interurban H4932 Taxi operation H4939 Other passenger land transport n.e.c. H5010 Sea and coastal passenger water transport H5030 Inland passenger water transport H5110 Passenger air transport I5510 Hotels and…
- 2021 February
- Labour force
- Nordic Region
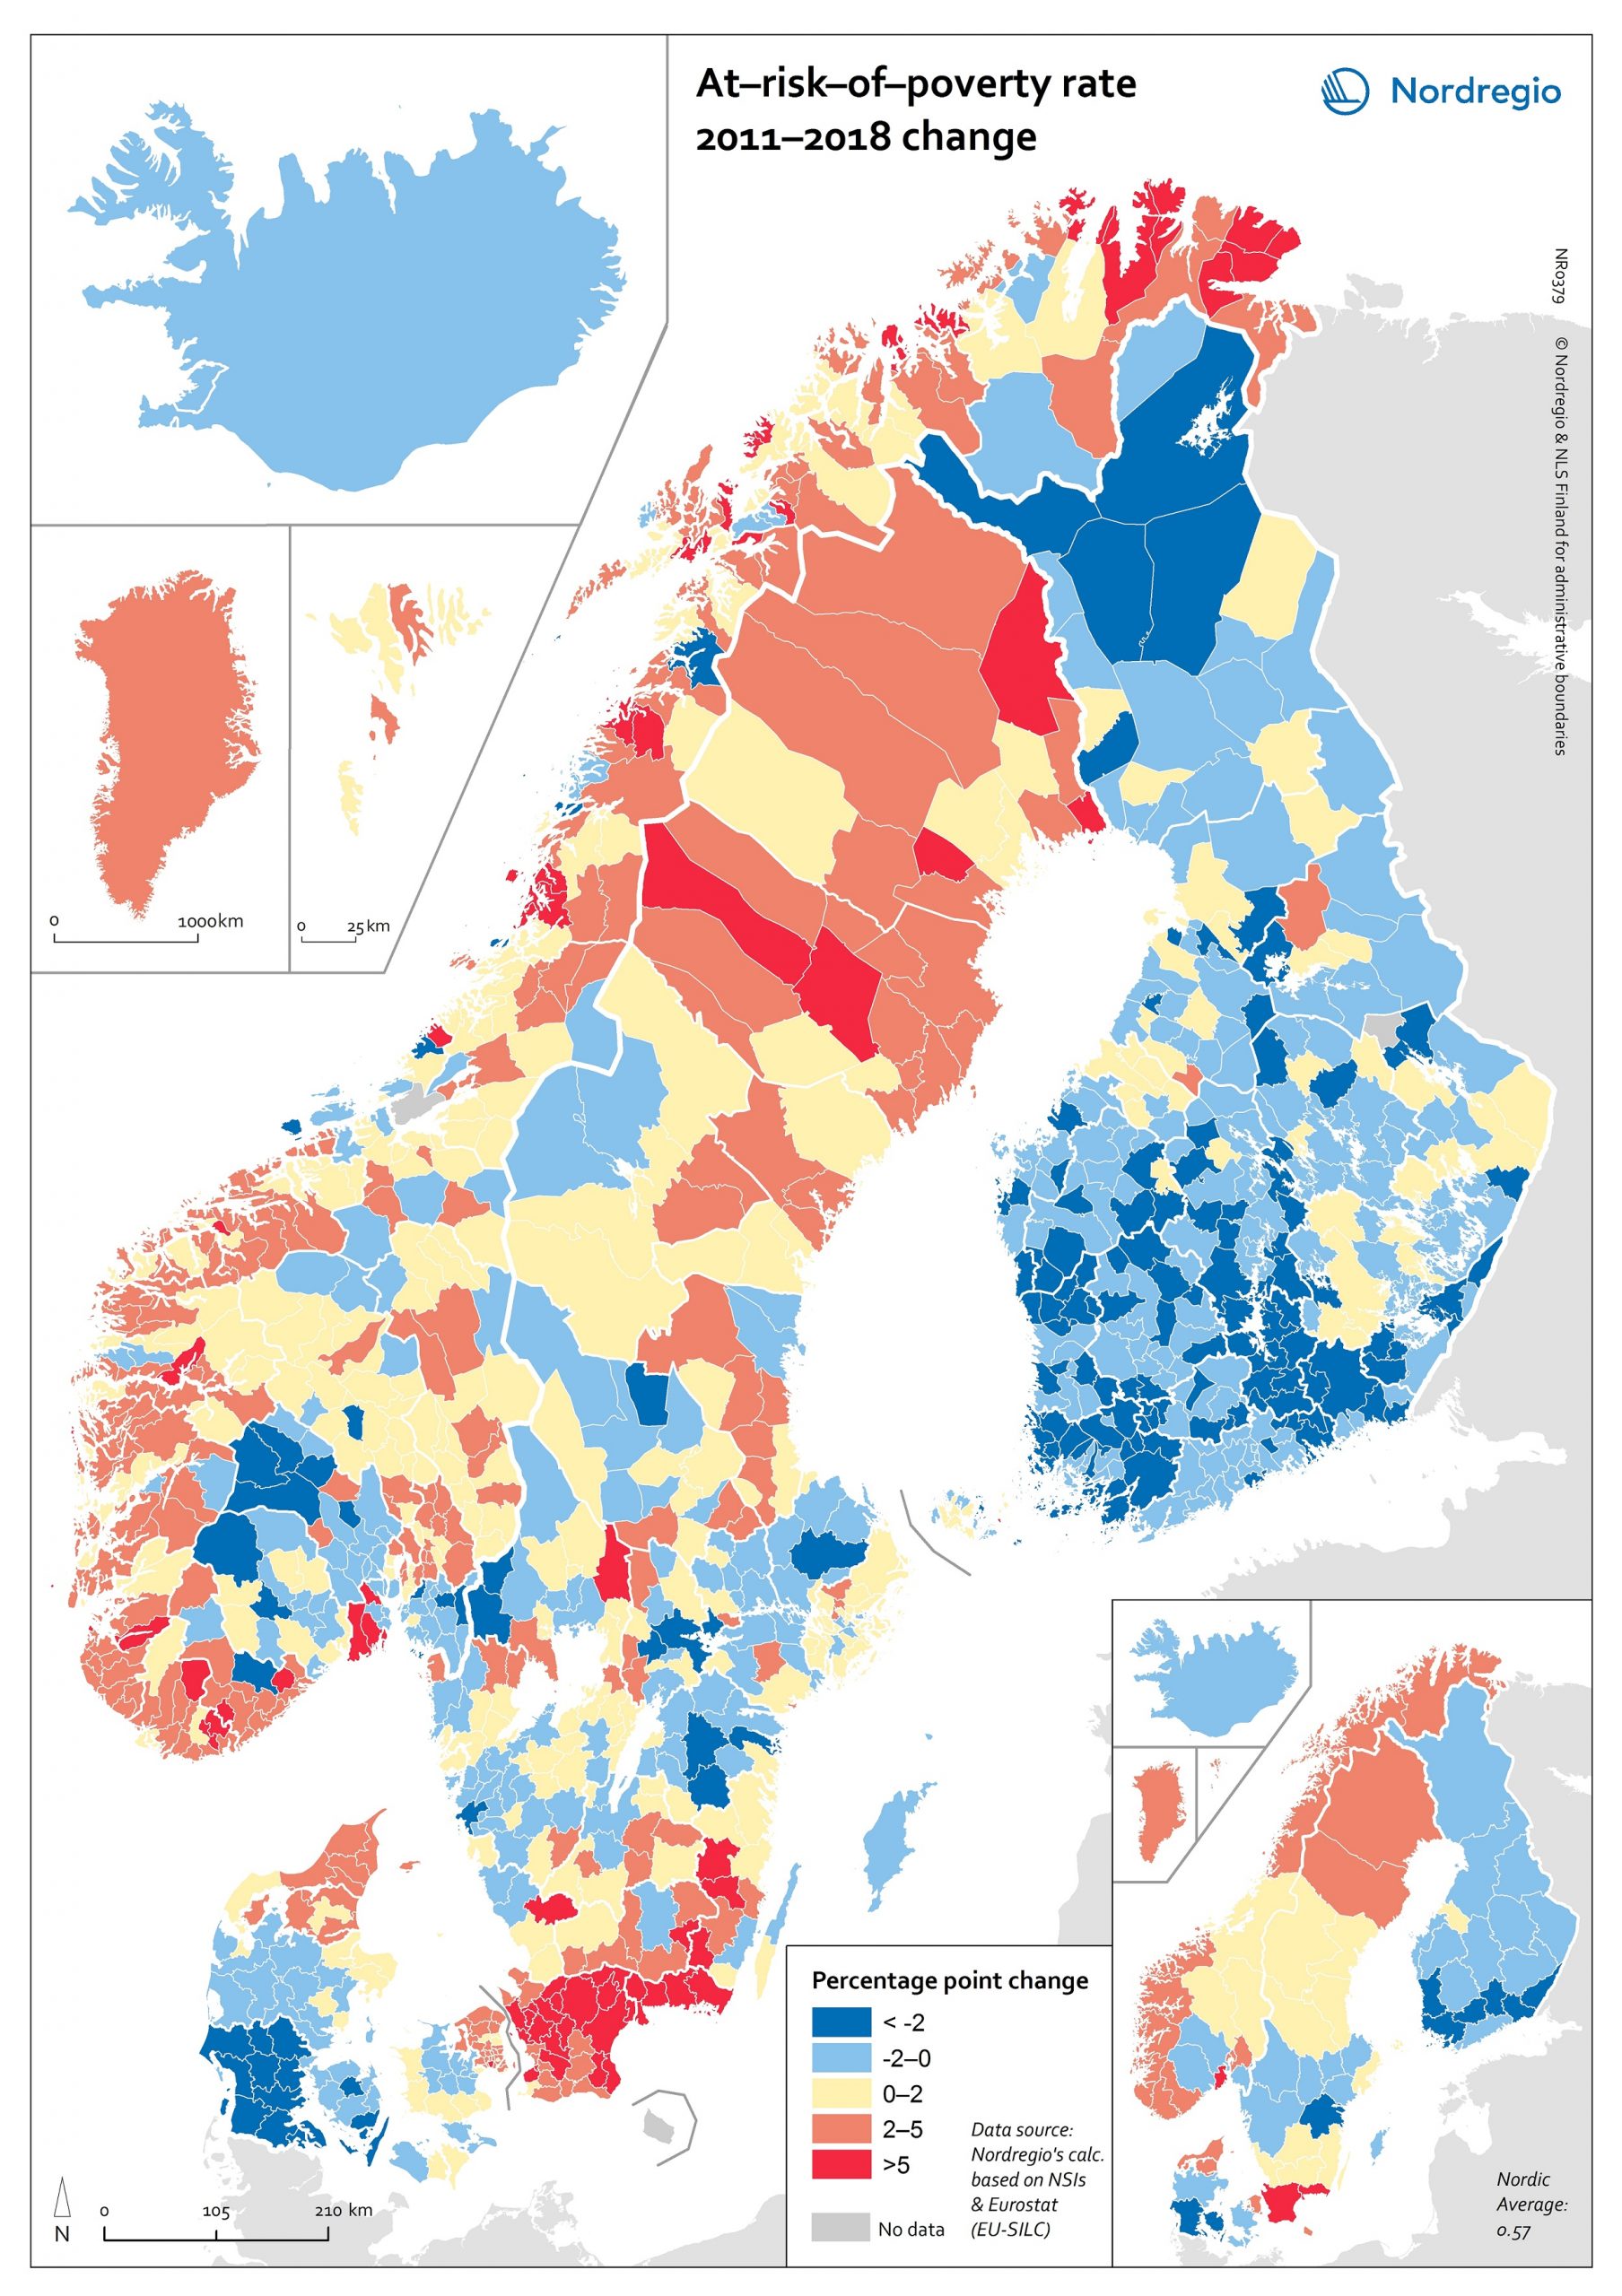
At-risk-of-poverty rate 2011-2018 change
The map shows the “at-risk-of-poverty” (AROP) rate in the Nordic Region. For the period from 2004 to 2018, the AROP rate increased in all Nordic countries except Iceland. This trend was strongest in Sweden. In Finland the AROP rate has been decreasing during the past few years, in line with what has previously been indicated – namely, on account of economic turmoil. This points to one of the weaknesses of using the AROP rate alongside several other measures of inequality. That is, while people have become poorer due to the economic crisis, the at-risk-of-poverty rate has paradoxically gone down. In addition, the AROP rate for Finland is higher in 2018 than it was in 2004. Looking at these trends on a regional level over a period of time (between 2011 and 2018), we can see that the AROP rate has decreased in almost all areas of Finland, whereas the pattern is rath er more varied in the other Nordic countries (we can also see a cohesive area in the south of Denmark where the AROP rate has decreased.) Again, Sweden has the most regions displaying increases in the AROP rate. Finland and Sweden contain the largest differences between the regions with the highest and lowest AROP rate. Hence the greatest regional differences are to be found in Sweden and Finland. Sweden also has the highest average AROP rate. About the At-risk-of-poverty The at-risk-of-poverty rate is a common measure of relative poverty and social inclusion. Most notably, it has been used for monitoring the EU2020 goal of inclusive growth. The at-risk-of-poverty rate is normally defined as “the share of people with an equivalised disposable income (after social transfer) below the at-risk-of-poverty threshold, which is set at 60% of the national median equivalised disposable income after social transfer.” (Eurostat). The indicator is…
- 2020 October
- Demography
- Economy
- Nordic Region
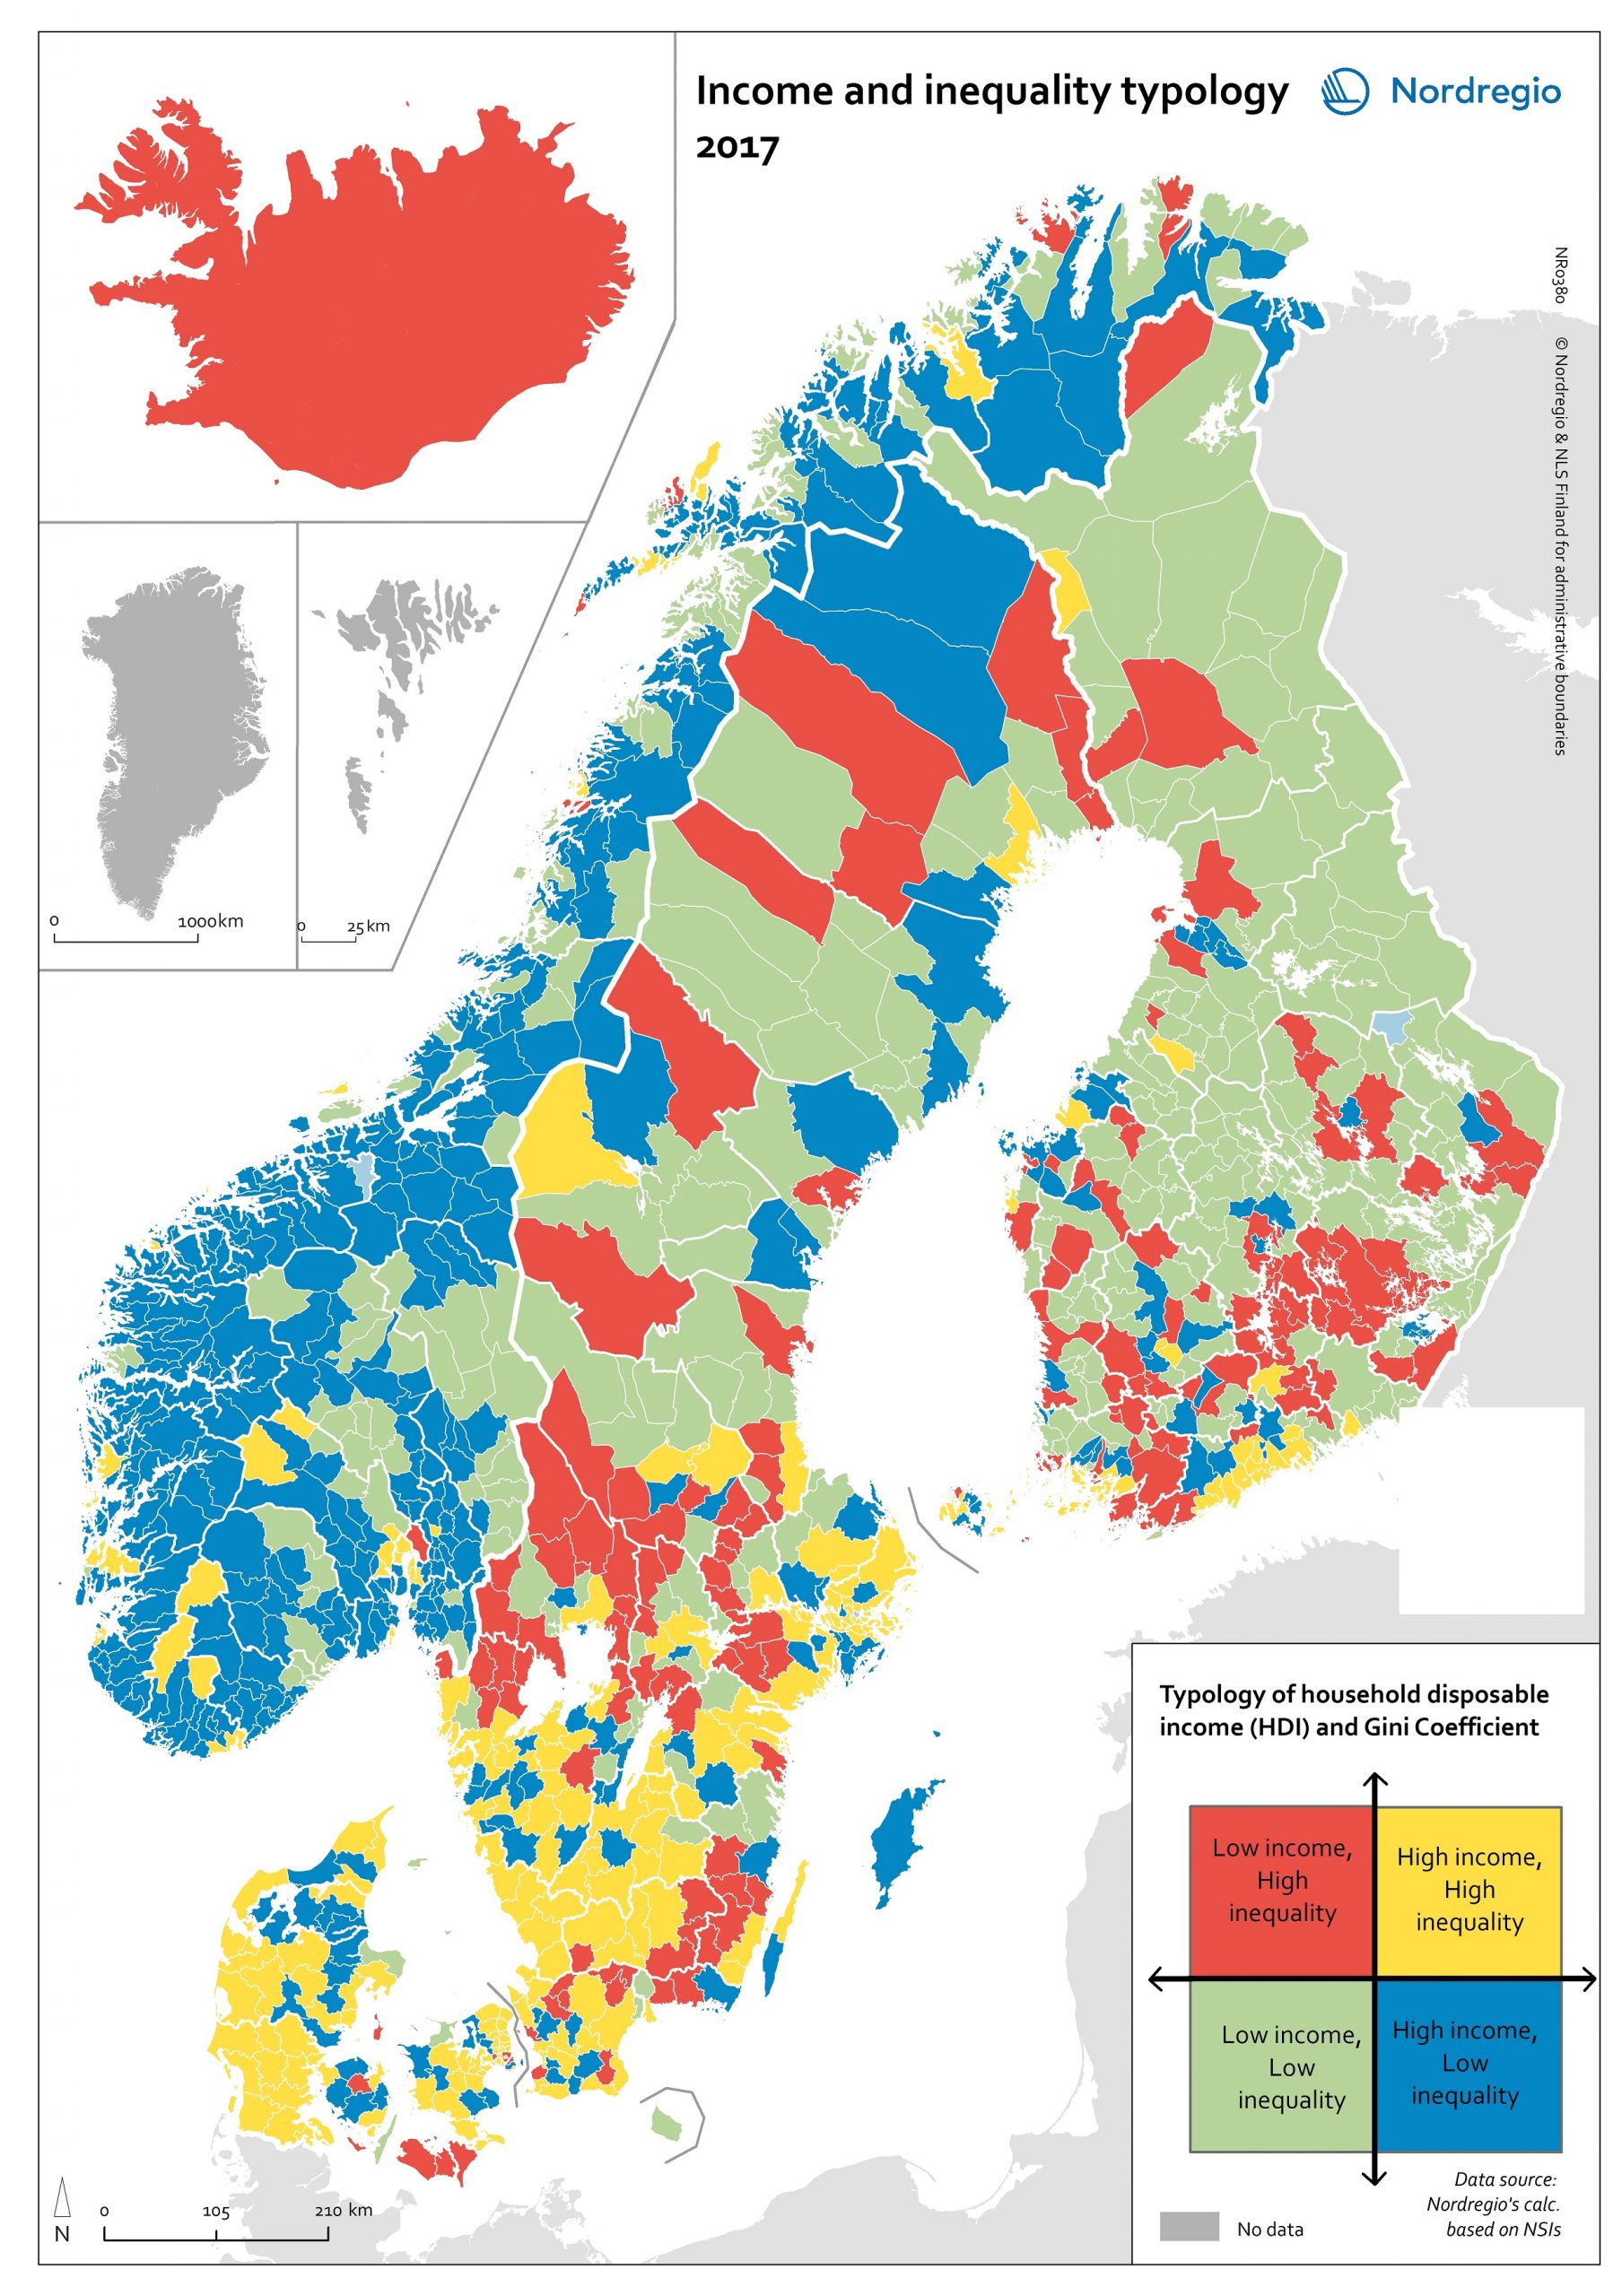
Income and inequality typology 2017
The map shows a typology, combining two indicators to display income disparities between and within municipalities. The map combines measurements of household disposable income (HDI) and the Gini Index to create four “types” of income distribution. Household disposable income is a common measure of income inequality. It measures the capacity of households (or individuals) to provide themselves with consumable goods or services. Comparing average HDIs is a convenient way of understanding inequality between municipalities. The Gini Index measures the extent to which the distribution of household income deviates from an equal distribution level. The Gini Index is therefore useful in understanding the inequality that exists within municipalities. Combining these measurements provides a comprehensive geographic overview of income in equality across the Nordic Region, both within and between municipalities. The municipalities shaded in yellow on the map have an average HDI above the Nordic average, as well as a Gini coefficient above the Nordic average (i.e. high income, but unevenly distributed). This category includes most of the wealthiest municipalities, including municipalities in the capital regions – e.g. most municipalities in the Stockholm Region (Lidingö, Danderyd, Ekerö, Täby, Sollentuna), Copenhagen (Gentofte, Hørsholm, etc.), and Helsinki (Kauniainen). Several municipalities in southern Sweden and Denmark also fall into this category. Most of these have average HDIs just above the Nordic average. The second category (blue on the map) consists of municipalities with HDI above the Nordic average and a Gini coefficient below the Nordic average (i.e. high income and even distribution). Most municipalities in this category are in Norway. Norway has a higher HDI and more even distribution than the other Nordic countries. The third category (green on the map) consists of municipalities with both an HDI and a Gini coefficient below the Nordic average (i.e. lower income, but more evenly distributed). This category…
- 2020 October
- Economy
- Nordic Region
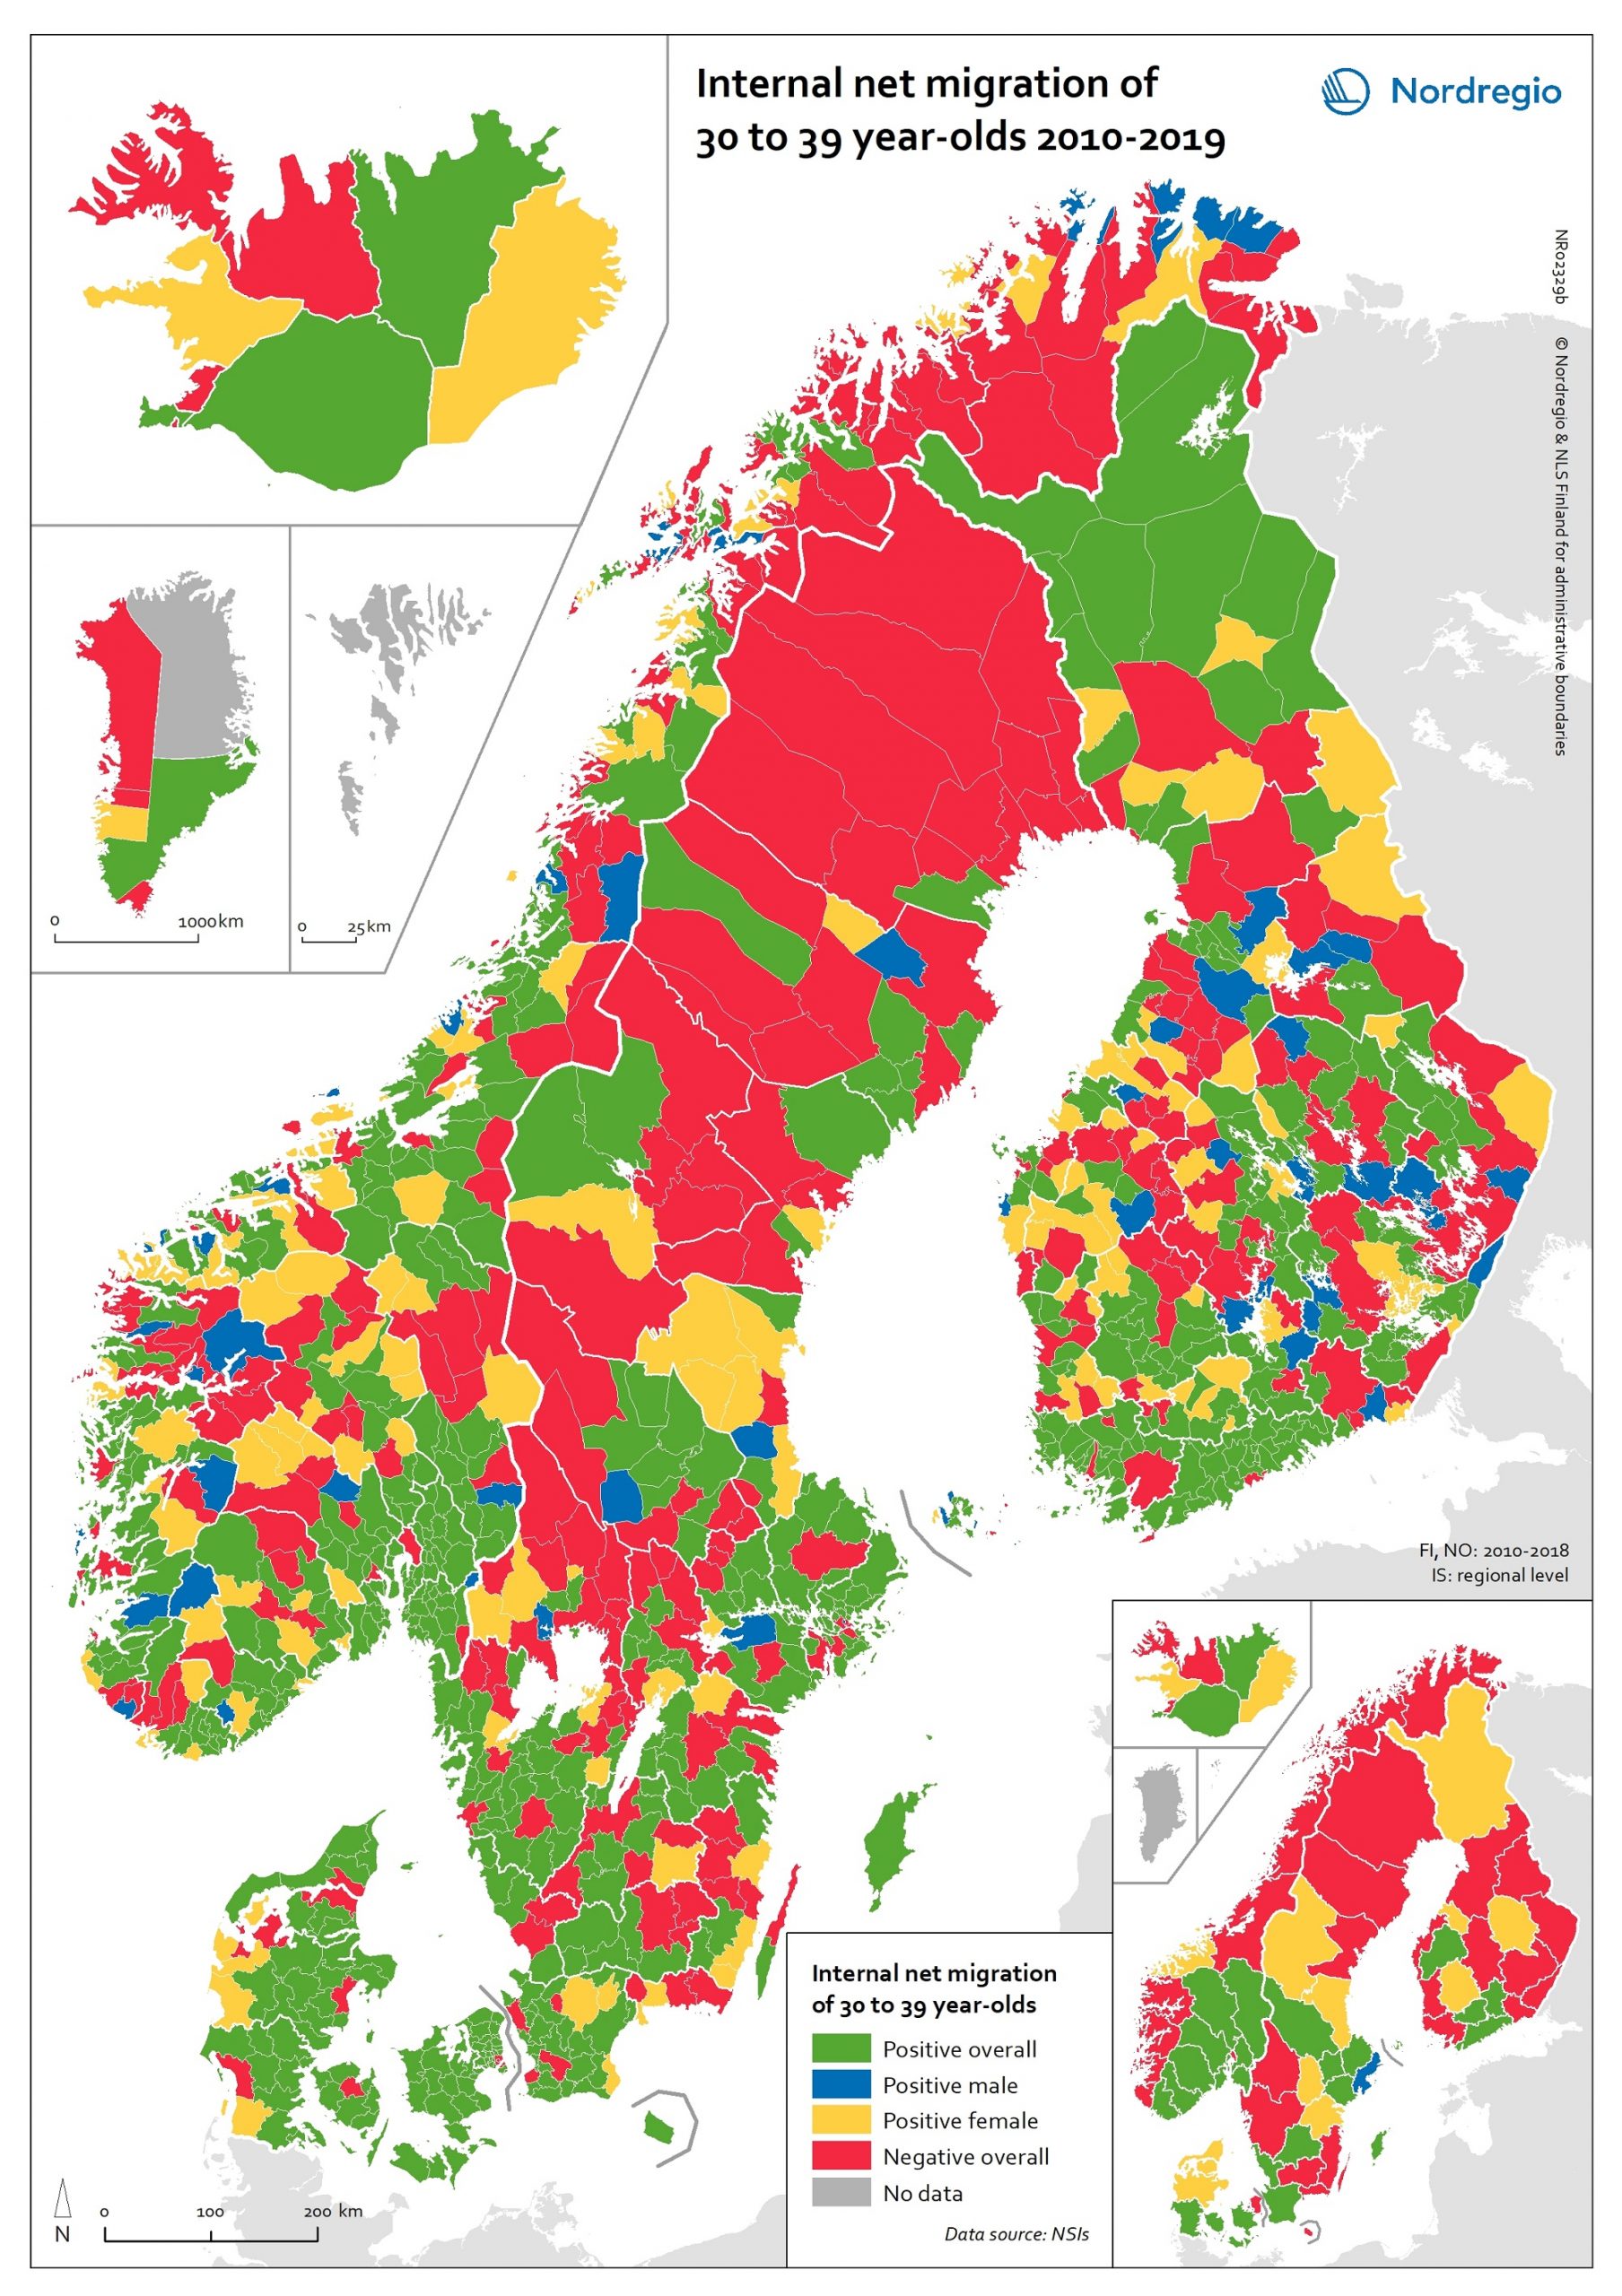
Internal net migration of 30 to 39 years-of-age, by gender, in 2010-2019
This map shows a typology that divides the Nordic municipalities and regions into four migration categories: positive net migration for both males and females (green on the map), positive male net migration (blue on the map), positive female net migration (yellow on the map), and negative net migration for both males and females (red on the map). These migration flows on 30 to 39-year-olds are of particular interest since it is often assumed that the future of rural regions is dependent upon their capability both to retain their populations and to attract newcomers, returning residents and second home owners. In this context, the map provides a rather positive picture, because a considerable proportion of rural municipalities have experienced positive net migration among females, males, or both sexes across all the Nordic countries. Even so, there is negative net migration among both females and males in many municipalities in northern Sweden, north-eastern Norway and eastern Finland, in addition to several inland municipalities within these countries. Interestingly, there is negative net migration among both sexes across all the capital city municipalities of the Nordic Region. According to the regional map, the capital city regions of Denmark, Iceland and Norway all experienced negative net migration of young people aged 30-39 years between 2010 and 2019. The capital city region of Sweden experienced positive net migration of males and negative net migration of females while the capital city region of Finland experienced positive net migration overall. Despite the majority of peripheral regions experiencing negative net migration of 30 to 39-year-olds during the time period studied, there are also several interesting examples of rural regions which experienced positive female net migration, for example Nordjylland (Denmark), Pohjois-Savo (Finland), Austurland (Iceland), Møre og Romsdal (Norway), and Jämtland (Sweden).
- 2020 October
- Demography
- Migration
- Nordic Region
